
Multi Node Condor and Pegasus on Ubuntu 12.04 on AWS EC2
| 发表时间:2014-06-24 20:24:13 | 评论:3 |
Recently I need to do some experiments with the Montage astronomical image mosaic engine, using Pegasus as the workflow management system. This involves setting up a condor cluster and Pegasus on the submit host, and several other steps to run Montage in such an environment. After extensive search on the Internet, I find out that there exists no good documentation on how to accomplish this complicate task with my favorite Linux distribution - Ubuntu 12.04. I decide write a tutorial on this topic, in the hope that it might save someone else's time in the future.
This tutorial includes the following three parts:
Single Node Condor and Pegasus on Ubuntu 12.04 on AWS EC2
Multi Node Condor and Pegasus on Ubuntu 12.04 on AWS EC2
Running Montage with Pegasus on AWS EC2
In the previous tutorial we have setup a single node Condor cluster with Pegasus. Now we will expand the Condor clutter to include multiple worker nodes. Keep the previous EC2 instance running, and we will call this instance the Master Node. The other Condor nodes will receive tasks from the Master Node, so we will call them Worker Nodes.
In this tutorial, we will show how to add one Worker Node to the cluster.
[STEP 1: Updating Security Group Settings]
The Master Node and the Worker Node should be able to communicate with each other. The easiest way to achieve this is to run both the Master Node and the Worker Node in the same VPC, and use the same security group for both the Master Node and the Worker Node . Edit the inbound rules of the security group, add a rule to allow all traffic from within the security group.
[STEP 2: Install Condor]
Similar to the previous tutorial, download the latest version of HTCondor (native package) for Ubuntu 12.04 from the following URL. What I have downloaded is condor-8.1.6-247684-ubuntu_12.04_amd64.deb. The actual filename might change over time.
http://research.cs.wisc.edu/htcondor/downloads/
Install Condor using the following commands:
$ sudo dpkg -i condor-8.1.6-247684-ubuntu_12.04_amd64.deb

$ sudo apt-get update

$ sudo apt-get install -f

$ sudo apt-get install chkconfig

$ sudo chkconfig condor on

$ sudo service condor start
Now we should have Condor up and running, and it should be automatically started when the system boots. Check into the status of Condor using the following commands:
$ condor_status

Name               OpSys      Arch   State     Activity LoadAv Mem   ActvtyTime


slot1@ip-10-0-5-11 LINUX      X86_64 Unclaimed Benchmar  0.060 1862  0+00:00:04

slot2@ip-10-0-5-11 LINUX      X86_64 Unclaimed Idle      0.000 1862  0+00:00:05

slot3@ip-10-0-5-11 LINUX      X86_64 Unclaimed Idle      0.000 1862  0+00:00:06

slot4@ip-10-0-5-11 LINUX      X86_64 Unclaimed Idle      0.000 1862  0+00:00:07

                     Total Owner Claimed Unclaimed Matched Preempting Backfill


        X86_64/LINUX     4     0       0         4       0          0        0


               Total     4     0       0         4       0          0        0


$ condor_q


-- Submitter: ip-10-0-5-114.ec2.internal :  : ip-10-0-5-114.ec2.internal

 ID      OWNER            SUBMITTED     RUN_TIME ST PRI SIZE CMD


0 jobs; 0 completed, 0 removed, 0 idle, 0 running, 0 held, 0 suspended
[STEP 3: Config Condor Master Node]
Use a text editor to open /etc/condor/condor_config, and add the following line to the end of the file:
ALLOW_WRITE = *
Then restart Condor with the following command:
$ sudo service condor restart
Also, find the IP address of the Master Node with the following command, you will need it to config the Worker Node.
[STEP 4: Config Condor Worker Node]
Now we go ahead to config the Worker Node. Use a text editor to open /etc/condor/condor_config.local, find the following line
CONDOR_HOST = $(FULL_HOSTNAME)
and update it with the IP address of the Master Node. Assuming that the IP address of the Master Node is 192.168.1.1, then this line should look like the following
CONDOR_HOST = 192.168.1.1
Then restart Condor using the following command:
$ sudo service condor restart
Now on both the Master Node and the Worker Node, we will be able to see both nodes. In the following example, both the Master Node and the Worker Node are c3.xlarge instances. Each of the c3.xlarge instance have 4 vCPU's, so we are seeing 8 slots in the cluster.
$ condor_status

Name               OpSys      Arch   State     Activity LoadAv Mem   ActvtyTime


slot1@ip-10-0-5-11 LINUX      X86_64 Unclaimed Idle      0.000 1862  0+00:04:36

slot2@ip-10-0-5-11 LINUX      X86_64 Unclaimed Idle      0.000 1862  0+00:05:05

slot3@ip-10-0-5-11 LINUX      X86_64 Unclaimed Idle      0.000 1862  0+00:05:06

slot4@ip-10-0-5-11 LINUX      X86_64 Unclaimed Idle      0.000 1862  0+00:05:07

slot1@ip-10-0-5-11 LINUX      X86_64 Unclaimed Idle      0.040 1862  0+00:04:36

slot2@ip-10-0-5-11 LINUX      X86_64 Unclaimed Idle      0.000 1862  0+00:05:05

slot3@ip-10-0-5-11 LINUX      X86_64 Unclaimed Idle      0.000 1862  0+00:05:06

slot4@ip-10-0-5-11 LINUX      X86_64 Unclaimed Idle      0.000 1862  0+00:05:07

                     Total Owner Claimed Unclaimed Matched Preempting Backfill


        X86_64/LINUX     8     0       0         8       0          0        0


               Total     8     0       0         8       0          0        0
[STEP 5: Add More Worker Nodes]
To add more Worker Nodes, you can create an AMI out of the first Worker Node, than launch as many Worker Nodes as needed. Since the AMI has the above-mentioned configurations, they should be automatically added to the cluster when they are in running state.
Single Node Condor and Pegasus on Ubuntu 12.04 on AWS EC2
| 发表时间:2014-06-24 18:46:18 | 评论:1 |
Recently I need to do some experiments with the Montage astronomical image mosaic engine, using Pegasus as the workflow management system. This involves setting up a condor cluster and Pegasus on the submit host, and several other steps to run Montage in such an environment. After extensive search on the Internet, I find out that there exists no good documentation on how to accomplish this complicate task with my favorite Linux distribution - Ubuntu 12.04. I decide write a tutorial on this topic, in the hope that it might save someone else's time in the future.
This tutorial includes the following three parts:
Single Node Condor and Pegasus on Ubuntu 12.04 on AWS EC2
Multi Node Condor and Pegasus on Ubuntu 12.04 on AWS EC2
Running Montage with Pegasus on AWS EC2
[STEP 1: Create an EC2 Instance for the Master Host]
Create an EC2 instance with a Ubuntu 12.04 AMI. For testing purposes you might wish to take advantage of the spot instance to save money. Use one of the compute optimized (C3) instance types so that you will see multiple Condor slots with a single EC2 instance. In this document I use c3.xlarge, which has 4 vCPU's.
For a single node setup, all you need to do with the security group setting is open up port 22 to your IP address so that you can SSH to the instance when it is up.
When the instance is up and running, SSH to the instance.
ssh -i yourkey.pem ubuntu@ip_of_the_instance
[STEP 2: Install Condor]
Download the latest version of HTCondor (native package) for Ubuntu 12.04 from the following URL. What I have downloaded is condor-8.1.6-247684-ubuntu_12.04_amd64.deb. The actual filename might change over time.
http://research.cs.wisc.edu/htcondor/downloads/
Install Condor using the following commands:
$ sudo dpkg -i condor-8.1.6-247684-ubuntu_12.04_amd64.deb

$ sudo apt-get update

$ sudo apt-get install -f

$ sudo apt-get install chkconfig

$ sudo chkconfig condor on

$ sudo service condor start
Now we should have Condor up and running, and it should be automatically started when the system boots. Check into the status of Condor using the following commands:
$ condor_status

Name               OpSys      Arch   State     Activity LoadAv Mem   ActvtyTime


slot1@ip-10-0-5-11 LINUX      X86_64 Unclaimed Benchmar  0.060 1862  0+00:00:04

slot2@ip-10-0-5-11 LINUX      X86_64 Unclaimed Idle      0.000 1862  0+00:00:05

slot3@ip-10-0-5-11 LINUX      X86_64 Unclaimed Idle      0.000 1862  0+00:00:06

slot4@ip-10-0-5-11 LINUX      X86_64 Unclaimed Idle      0.000 1862  0+00:00:07

                     Total Owner Claimed Unclaimed Matched Preempting Backfill


        X86_64/LINUX     4     0       0         4       0          0        0


               Total     4     0       0         4       0          0        0

$ condor_q


-- Submitter: ip-10-0-5-114.ec2.internal :  : ip-10-0-5-114.ec2.internal

 ID      OWNER            SUBMITTED     RUN_TIME ST PRI SIZE CMD


0 jobs; 0 completed, 0 removed, 0 idle, 0 running, 0 held, 0 suspended
[STEP 3: Install Pegasus]
Pegasus needs Java (1.6 or higher) and Python (2.4 or higher). Ubuntu 12.04 comes with Python 2.7 but not Java, so we will need to install Java first. Optionally Pegasus also needs Globus for grid support, we will take care of Globus later.
$ sudo apt-get install openjdk-7-jdk
Then we config the Pegasus repository and install Pegasus.
$ gpg --keyserver pgp.mit.edu --recv-keys 81C2A4AC

$ gpg -a --export 81C2A4AC | sudo apt-key add -
All the following line into /etc/apt/source.list:
deb http://download.pegasus.isi.edu/wms/download/debian wheezy main
Update the repository and install Pegasus:
$ sudo apt-get update

$ sudo apt-get install pegasus
Now we should have Pegasus installed on the system. Check the installation with the following command. If you see similar output, congratulations!
$ pegasus-status

(no matching jobs found in Condor Q)
Pegasus comes with some examples, we will use these example to test the installation further.
$ cd ~

$ cp -r /usr/share/pegasus/examples .

$ cd examples/hello-world

$ ls

dax-generator.py  hello.sh  pegasusrc  submit  world.sh
Run the hello-world example:
$ ./submit

2014.06.24 10:34:00.455 UTC:   Submitting job(s).

2014.06.24 10:34:00.460 UTC:   1 job(s) submitted to cluster 1.

2014.06.24 10:34:00.465 UTC:

2014.06.24 10:34:00.471 UTC:   -----------------------------------------------------------------------

2014.06.24 10:34:00.476 UTC:   File for submitting this DAG to Condor           : hello_world-0.dag.condor.sub

2014.06.24 10:34:00.481 UTC:   Log of DAGMan debugging messages                 : hello_world-0.dag.dagman.out

2014.06.24 10:34:00.487 UTC:   Log of Condor library output                     : hello_world-0.dag.lib.out

2014.06.24 10:34:00.492 UTC:   Log of Condor library error messages             : hello_world-0.dag.lib.err

2014.06.24 10:34:00.497 UTC:   Log of the life of condor_dagman itself          : hello_world-0.dag.dagman.log

2014.06.24 10:34:00.503 UTC:

2014.06.24 10:34:00.508 UTC:   -----------------------------------------------------------------------

2014.06.24 10:34:00.513 UTC:

2014.06.24 10:34:00.519 UTC:   Your workflow has been started and is running in the base directory:

2014.06.24 10:34:00.524 UTC:

2014.06.24 10:34:00.530 UTC:     /home/ubuntu/examples/hello-world/work/ubuntu/pegasus/hello_world/20140624T103359+0000

2014.06.24 10:34:00.535 UTC:

2014.06.24 10:34:00.540 UTC:   *** To monitor the workflow you can run ***

2014.06.24 10:34:00.546 UTC:

2014.06.24 10:34:00.551 UTC:     pegasus-status -l /home/ubuntu/examples/hello-world/work/ubuntu/pegasus/hello_world/20140624T103359+0000

2014.06.24 10:34:00.556 UTC:

2014.06.24 10:34:00.562 UTC:   *** To remove your workflow run ***

2014.06.24 10:34:00.567 UTC:

2014.06.24 10:34:00.572 UTC:     pegasus-remove /home/ubuntu/examples/hello-world/work/ubuntu/pegasus/hello_world/20140624T103359+0000

2014.06.24 10:34:00.578 UTC:

2014.06.24 10:34:01.024 UTC:   Time taken to execute is 1.109 seconds
Check the status of the Pegasus jobs and Condor queue using the pegasus-statua and condor_q commands:
$ pegasus-status

STAT  IN_STATE  JOB

Run      01:05  hello_world-0

Summary: 1 Condor job total (R:1)


$ condor_q


-- Submitter: ip-10-0-5-114.ec2.internal :  : ip-10-0-5-114.ec2.internal

 ID      OWNER            SUBMITTED     RUN_TIME ST PRI SIZE CMD

   1.0   ubuntu          6/24 10:34   0+00:01:28 R  0   0.0  pegasus-dagman -f


1 jobs; 0 completed, 0 removed, 0 idle, 1 running, 0 held, 0 suspended
After the hello-world workflow have been executed, a trace file (jobstat.log) can be found in the working directory. Workflow related information is hidden several sub-directories deep. In my case the directory is ~/examples/hello-world/work/ubuntu/pegasus/hello_world/20140624T103359+0000. Please note that the last sub-directory is a timestamp, depending on the time you submit the workflow.
As a bonus of this tutorial, I have prepared an AMI with the above-mentioned setup, and make the AMI publicly available to the community. If all you need is a single node Pegasus + Condor configuration, you don't need to repeat any of the above-mentioned steps. All you need to do is to launch an EC2 instance with AMI ami-5ee01b36 in the US-EAST-1 (N. Virginia) region. If you need to run this in other regions, copy the AMI to the desired region and launch an instance with the copied AMI in that region.
CY14-Q1 OpenStack, OpenNebula,Eucalyptus,CloudStack社区活跃度比较
| 发表时间:2014-04-14 16:19:12 | 评论:1 |
本文是对《CY13-Q4 OpenStack, OpenNebula,Eucalyptus,CloudStack社区活跃度比较》一文的补充和更新。对本文内容感兴趣的读者,可以通过电子邮件或者新浪微博(@qyjohn_)与我联系。
本文同时发布了一个英文版本,可以参见CY14-Q1 Community Analysis — OpenStack vs OpenNebula vs Eucalyptus vs CloudStack这个帖子。
Eucalyptus在本季度终止了面向用户的在线论坛(Engage),并将所有与用户相关的讨论引导到google group。这个举措对其用户讨论有较大的影响。
这个社区活跃度比较项目起源于CY11-Q4,此篇报告是到目前为止已经发布的第十个季度性的报告。本文中所表达之观点完全是作者本人的观点,而非作者目前或以前所在公司的观点。
本文的目的是通过论坛和邮件列表的原始数据对OpenStack、OpenNebula、Eucalyptus和CloudStack项目的社区活跃度进 行分析和比较。主要的原始数据是自2009年来这四个项目的官方论坛和邮件列表每个月所产生的讨论主题数、帖子数、以及参与讨论的总人数(邮件地址或者用 户账号)。为了获取这些数据,我写了一个Java程 序自动地从这四个项目的网站下载了所有的论坛和邮件列表信息,并且从这些信息中分析提取出我所需要的数据。程序提取的数据被导入MySQL数据库中以便进 行统计分析,统计分析的结果通过LibreOffice生成分析图表。
在过去几年种,有一些早期的论坛和邮件列表已经被停用,这些数据我们再也不能够访问到了。幸好我们有这个项目刚刚启动时所创建的MySQL数据库,还有过去每个季度所发布的季度性报告,使得我们可以对每个项目进行完整的分析。
对于具有多个会员系统的项目(例如一个论坛和一个邮件列表),我们采取了大量的措施来消除会员重复计数(同一个人被当成不同的会员计算了两次或者两次以上)的情况。
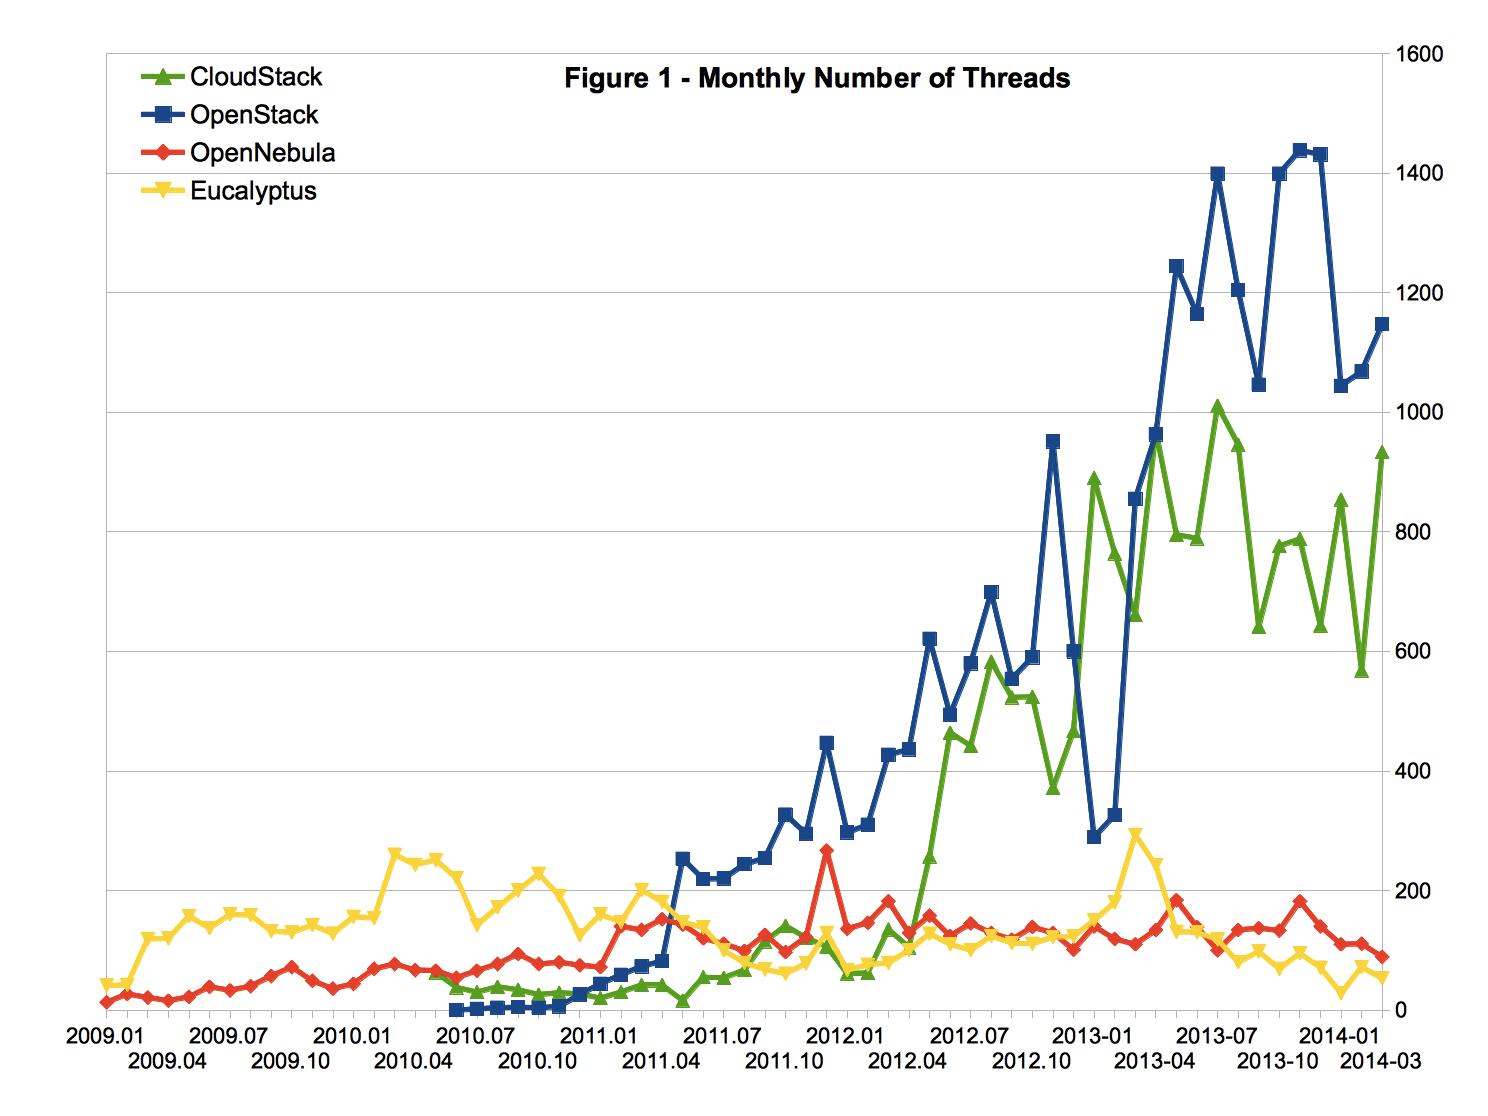
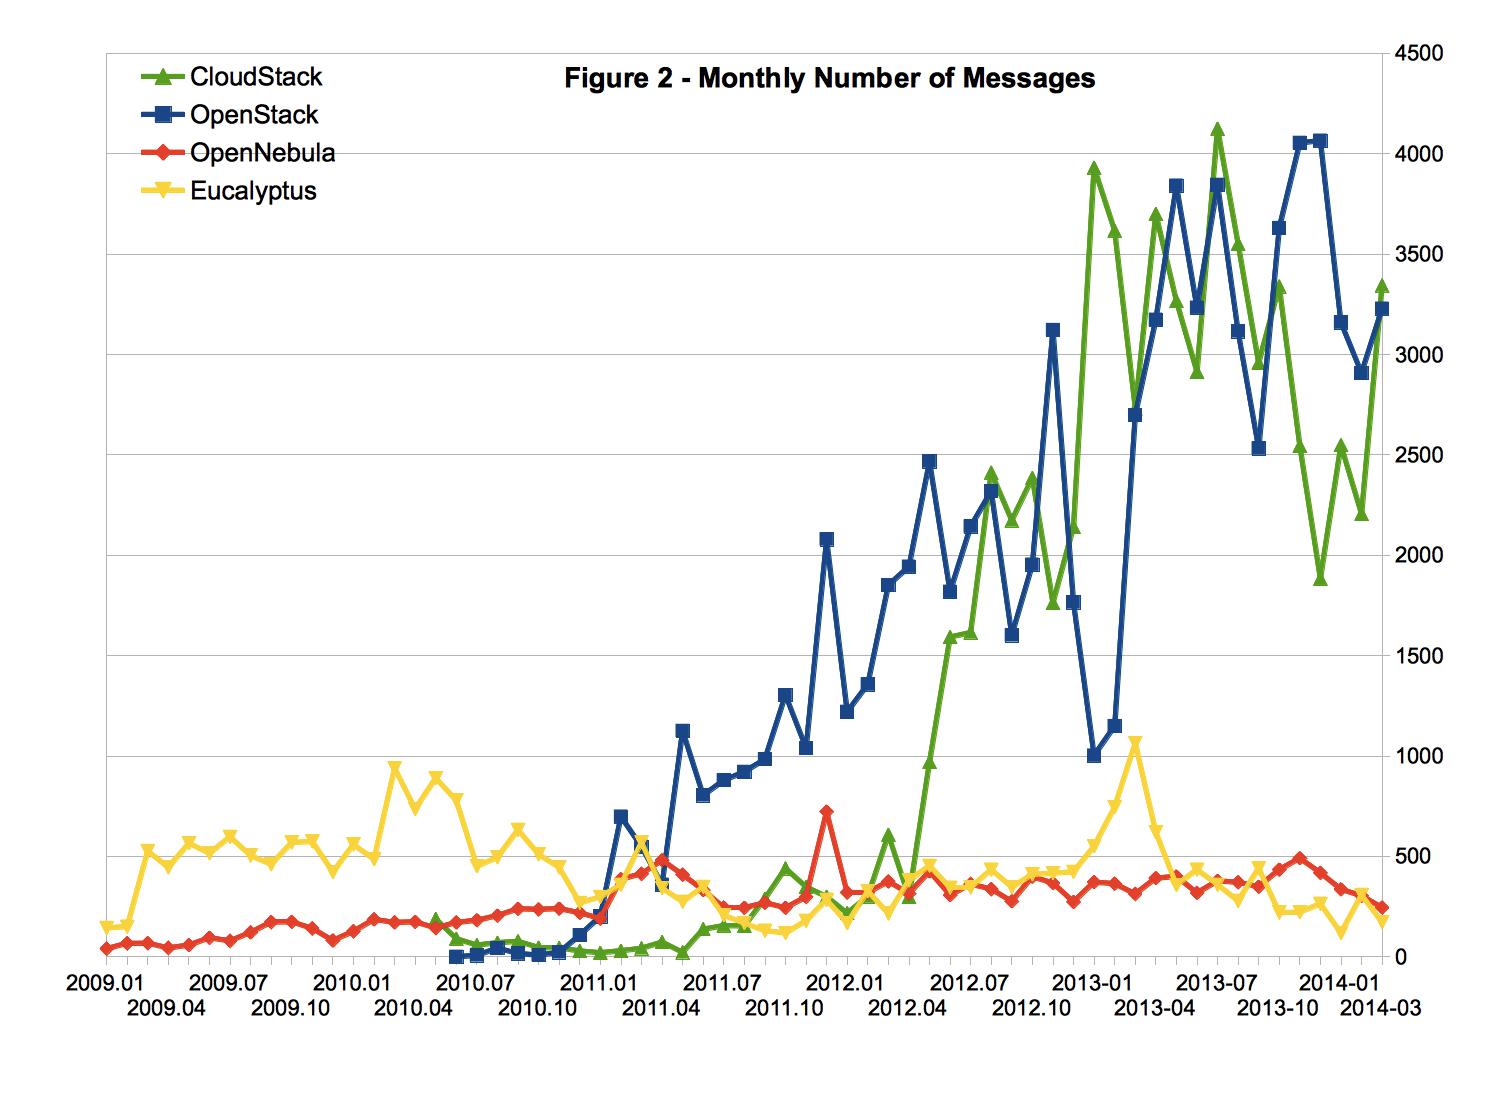
图1 和图2分别是如上所述四个项目每个月所产生的讨论主题数和帖子数。可以看出:
(1) 在过去12个月中,与OpenStack和CloudStack相关的讨论数量在同一水平上,与Eucalyptus和OpenNebula相关的讨论数量在同一水平上;
(2) 在过去12个月中,与OpenStack和CloudStack相关的讨论数量远大于与Eucalyptus和OpenNebula相关的讨论数量。
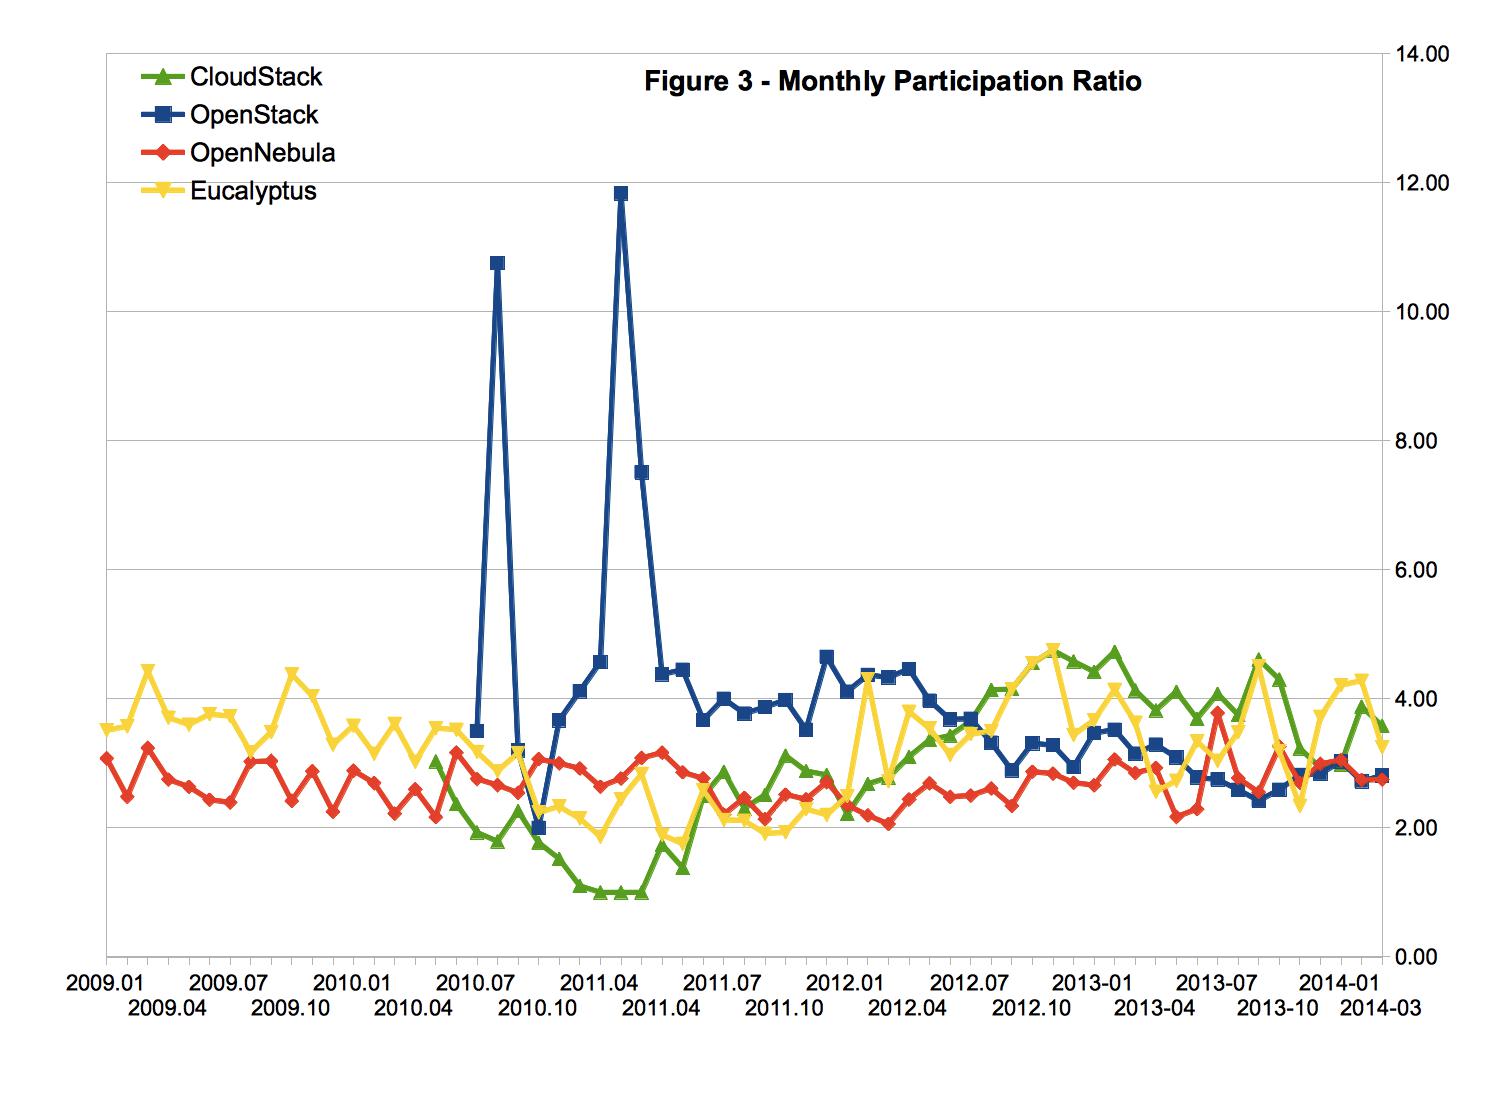
通常来讲,一个讨论主题得到的回复数越多,表明该主题的讨论越深入。一个论坛或者邮件列表如果只有主帖而没有回复,说明这个社区的参与程度很低。因此,平 均意义上的“讨论帖子数/讨论主题数”则反映了一个社区的参与程度,这里我们暂且称之为参与度(Participation Ratio)。
由图3 可以看出,在过去12个月中CloudStack和Eucalyptus项目的参与度相对较高高,接近于4;OpenStack与OpenNebula项目的参与度相对较低,接近于2。
我们也注意到参与度这个概念引起了一些争议。有些人认为“讨论帖子数/讨论主题数”较低象征着某个社区具有快速解决问题的能力,社区成员所提出的问题能够在很短时间内得到解答,因此不需要多个帖子来解决一个问题。有些人认为“讨论帖子数/讨论主题数”较高可能意味着某个社区可能出现了争论,而这种争论可能已经偏离了某个社区的讨论方向和范围。无论如何,参与度这个名称的确反映了我们的某些主观看法,在一定程度上削弱了本报告的客观性。由于我们暂时没有找到一个更加合适的替代名称,在这个报告里面还是延用原来的名称(欢迎各位读者贡献更好的参数名称)。
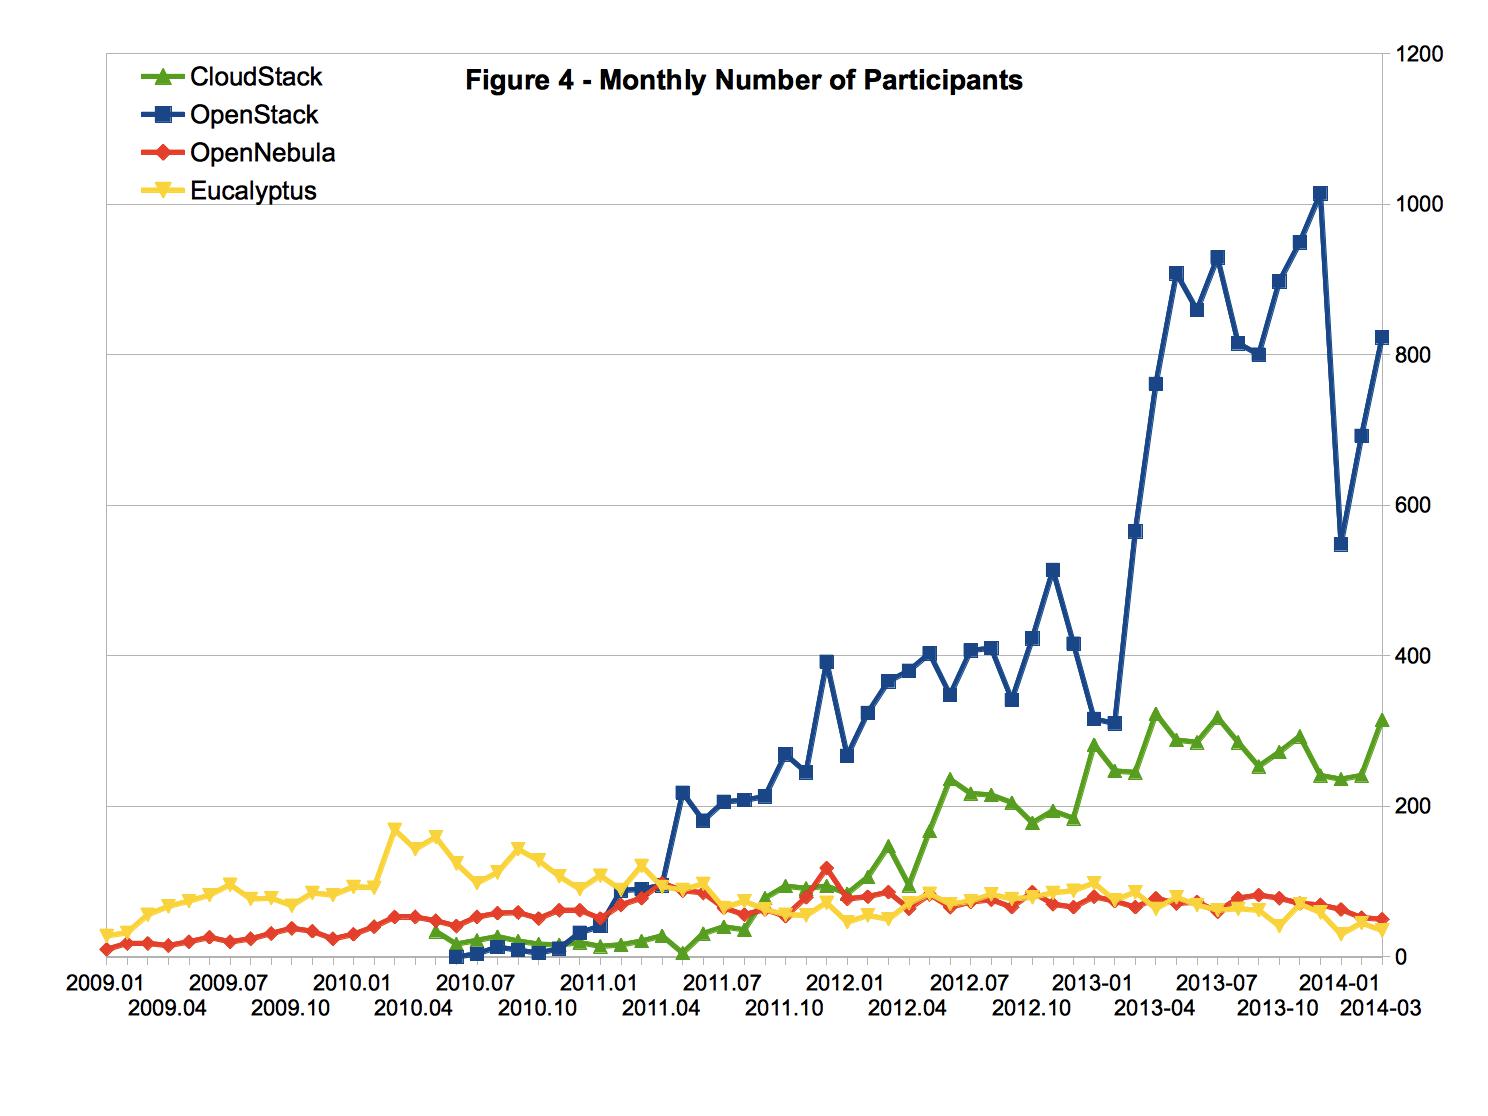
图4 所示为这四个项目每个月参与论坛或者邮件列表讨论的总人数。可以看出,OpenStack项目的活跃用户数量要远大于其他三个项目。CloudStack项目的活跃用户数量也明显大于OpenNebula和Eucalyptus。在过去12个月中,CloudStack和OpenStack项目的活跃用户数量都在稳步攀升(OpenStack项目有100%的增长,CloudStack项目有50%的增长),而Eucalyptus和OpenNebula项目的活跃用户数量基本上没有增长。
值得一提的是,虽然CloudStack的活跃用户数量稍微小于OpenStack,这两个项目的主题和帖子数量是基本相当的(参见图1和图2)。
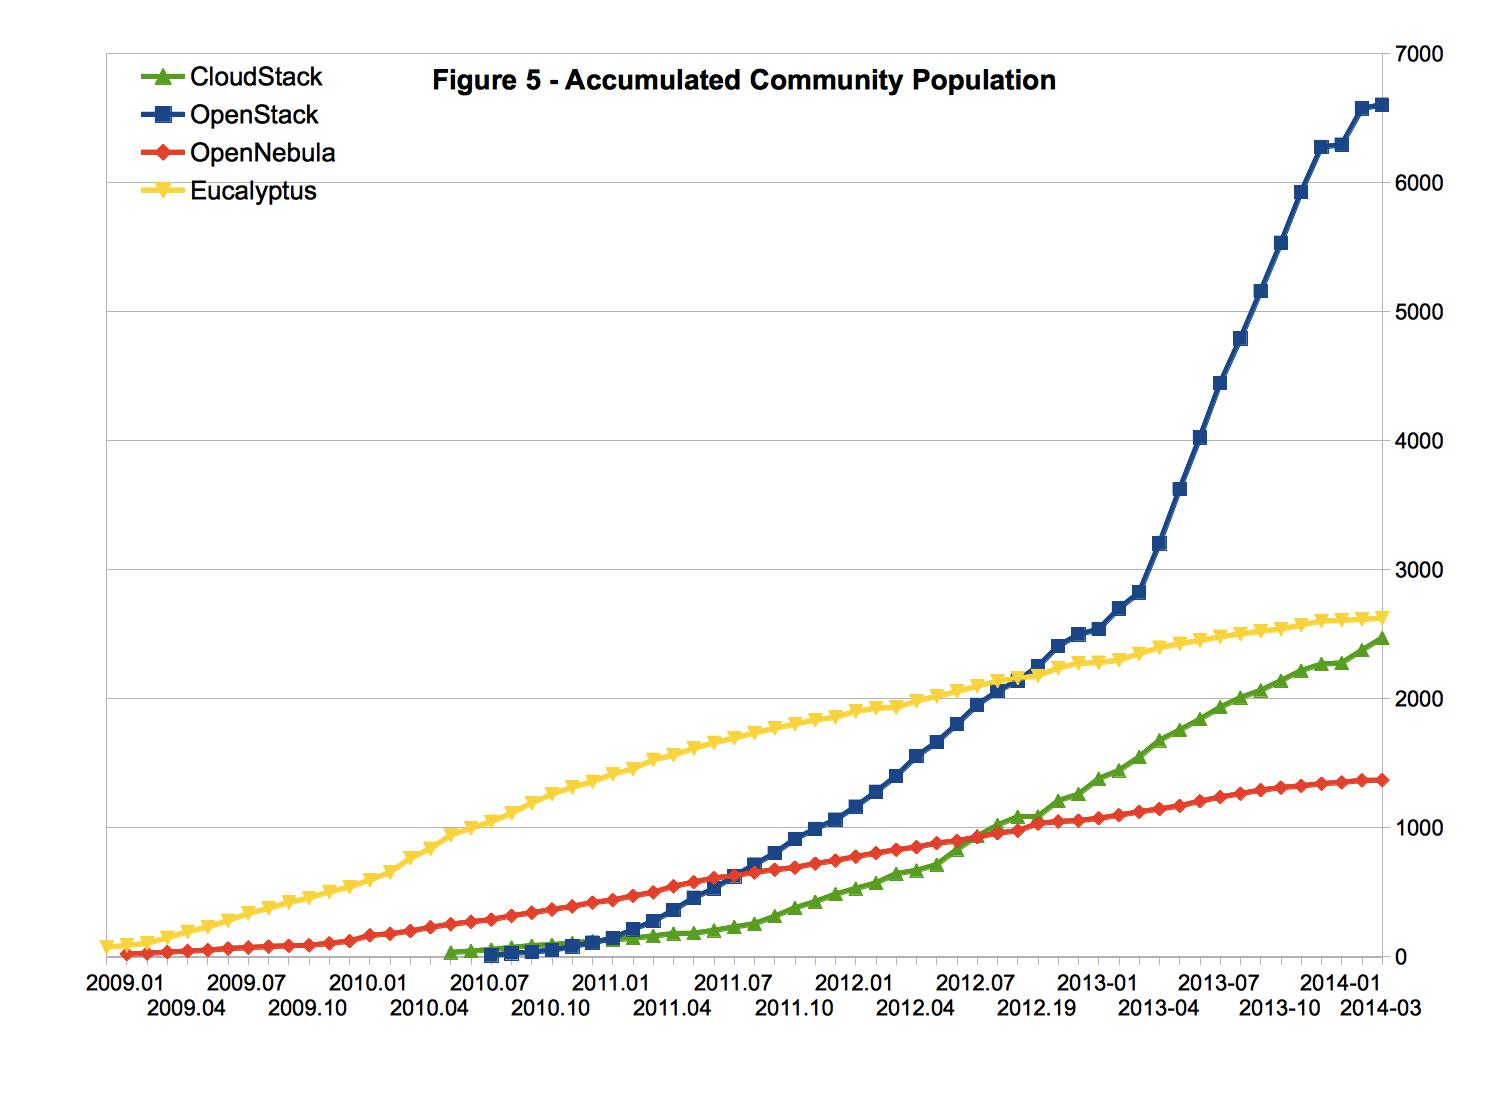
累计社区人口(简称社区人口)指的是曾经通过论坛或者邮件列表参与过讨论的用户和开发者总数。(不包括在论坛或者邮件列表中注册但是从未公开参与讨论的社 区成员。)这些人或多或少地使用过相关产品,但是并不代表他们目前还是活跃用户。图5 所示为这四个项目的社区人口增长趋势。可以看出,OpenStack与Eucalyptus项目的社区人口遥遥领先,CloudStack与OpenNebula项目的社区人口相对较低。
问题在于,开源IaaS软件经过这么多年的发展,长期累计社区人口的意义已经越来越弱。一方面,某些早期用户可能已经多次改变了阵营;另一方面,某些早期论坛和邮件列表已经结束了历史使命。从社区活跃度的角度来看,我们认为最近6 个月或者最近12个月的累计社区人口可能是有意义的,但是将累计社区人口无限制地延伸到侏罗纪时代,可能会使这个参数失去实用价值。
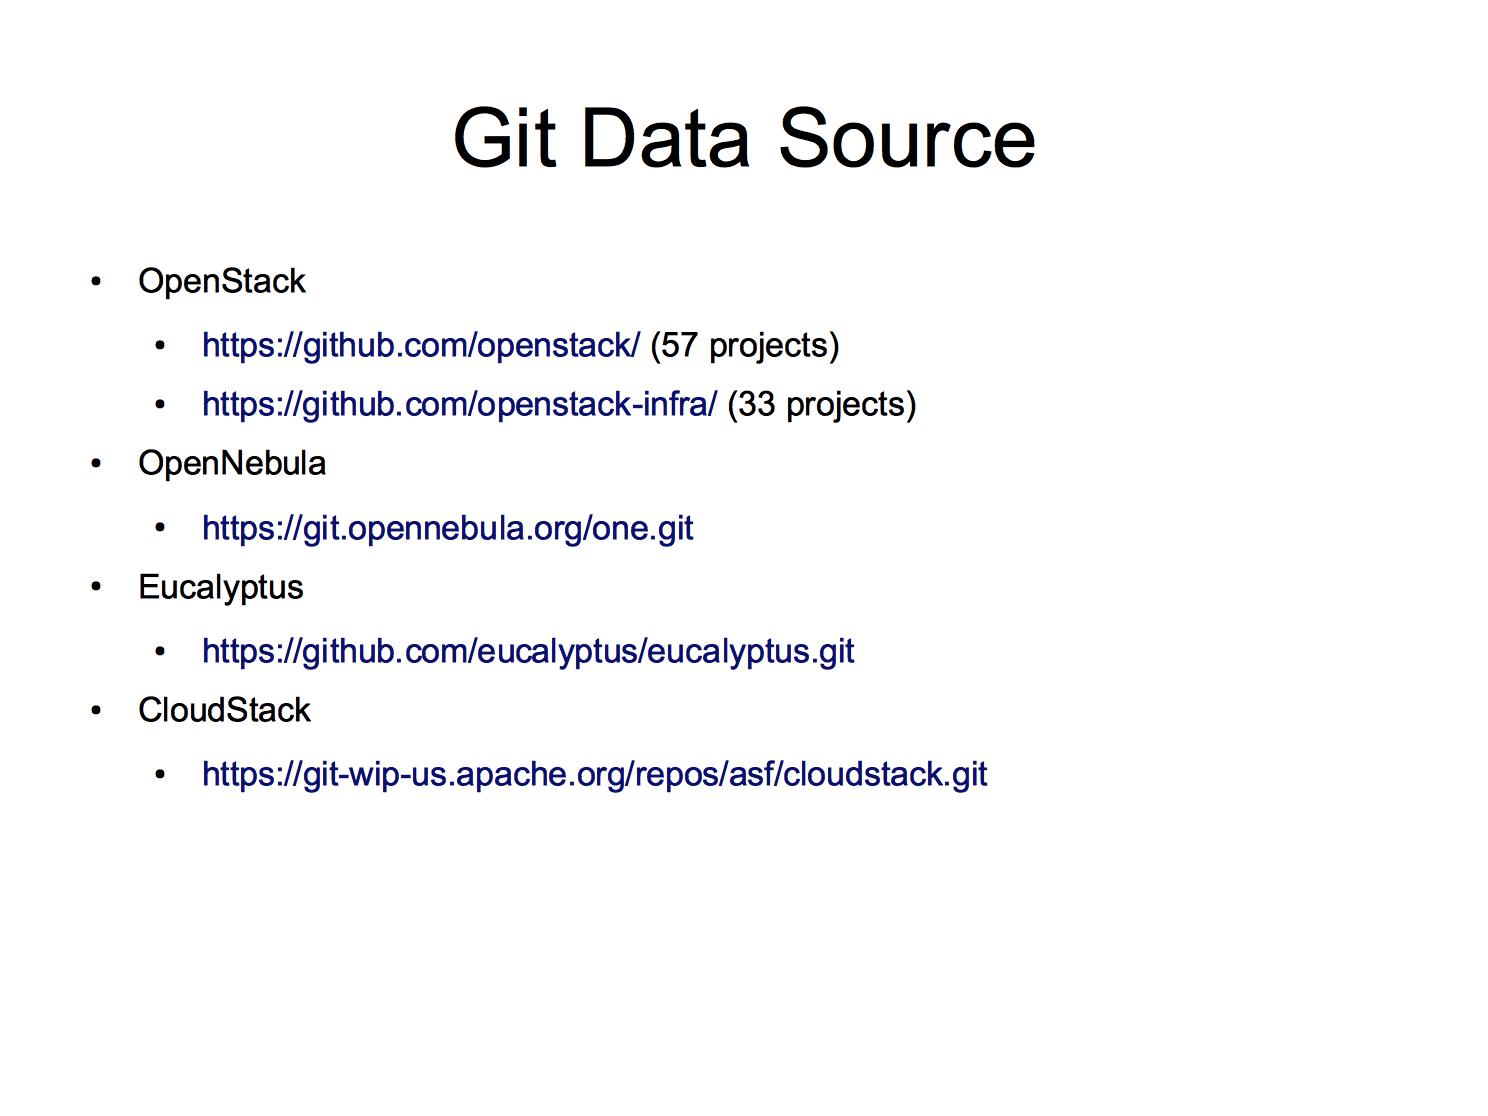
曾经有多位读者建议我们基于Git活动对各个主流的开源IaaS项目的开发情况进行分析。我们注意到CloudStack、Eucalyptus、OpenNebula以及OpenStack项目都使用git进行版本管理。因此,我们基于来自git的日志数据对这几个项目的开发情况进行了一些简单的分析。需要指出的是,对于OpenStack项目来说,其数据源包括了托管在github.com上的openstack项目(包含57个子项目)和openstack-infra项目(包含33个子项目)。
在CY13-Q1报告中,我们使用了git log这个命令获取日志数据。从CY13-Q2起,我们将使用git log –no-merges这个命令获取日志数据。
值得一提的是,git是一个分布式的版本管理系统。使用git进行版本管理,开发人员通常都是在本地代码库上工作。当开发人员执行一次commit操作时,对应的代码改动只被记录在本地代码库中。除非时开发人员执行了push操作,这些代码改动不会被反映到主代码库中。很多开发人员倾向于在积累了一定数量的commit之后才进行push操作。因此,一些最近发生的commit操作不会被反映到我们的统计中来。根据我们的经验,上一个月的commit操作数量大概被低估了50%,而前一个月的commit操作数量大概被低估了20%。
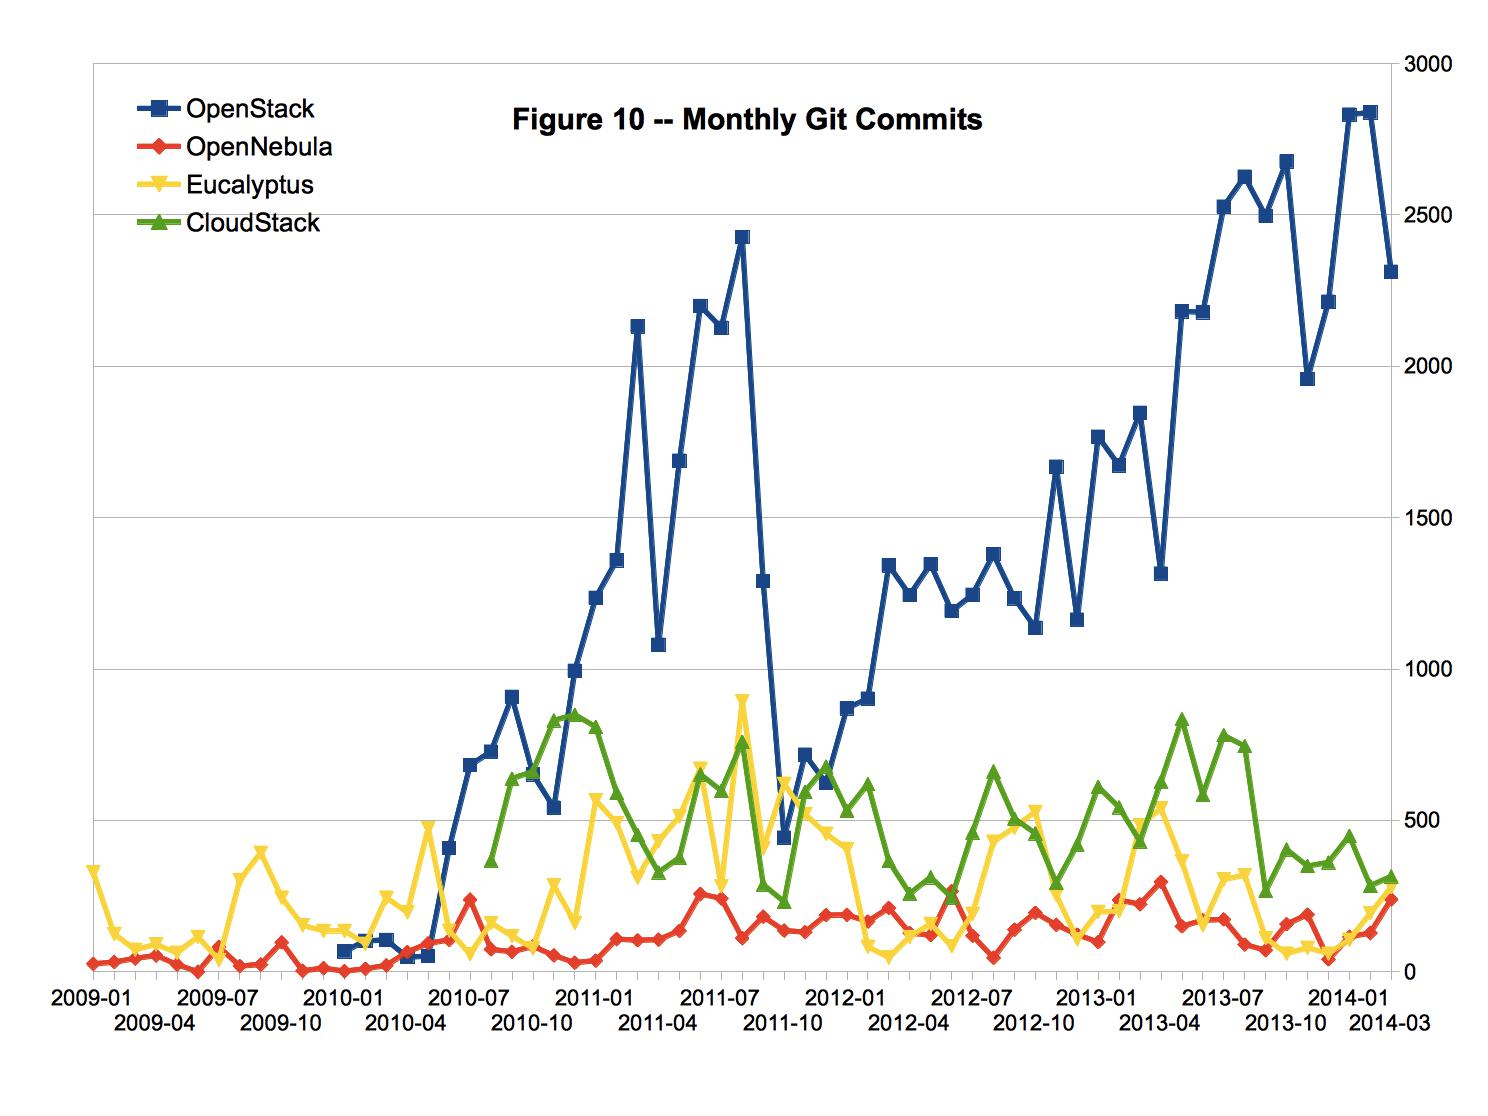
图10所示分别是本文所述四个项目每个月进行提交(commit)操作的次数。总体来看,OpenStack项目提交代码的频率远远超过其他三个项目。这是由于OpenStack项目的数据源一共包含了90个子项目。CloudStack项目提交代码的频率也明显高于Eucalyptus和OpenNebula。与OpenNebula项目相比较,Eucalyptus项目提交代码的频率也不低,但是存在较大的波动情况,具有比较明显的批量更新的特征。OpenNebula项目提交代码的频率较低,平均每个月提交代码200次左右。
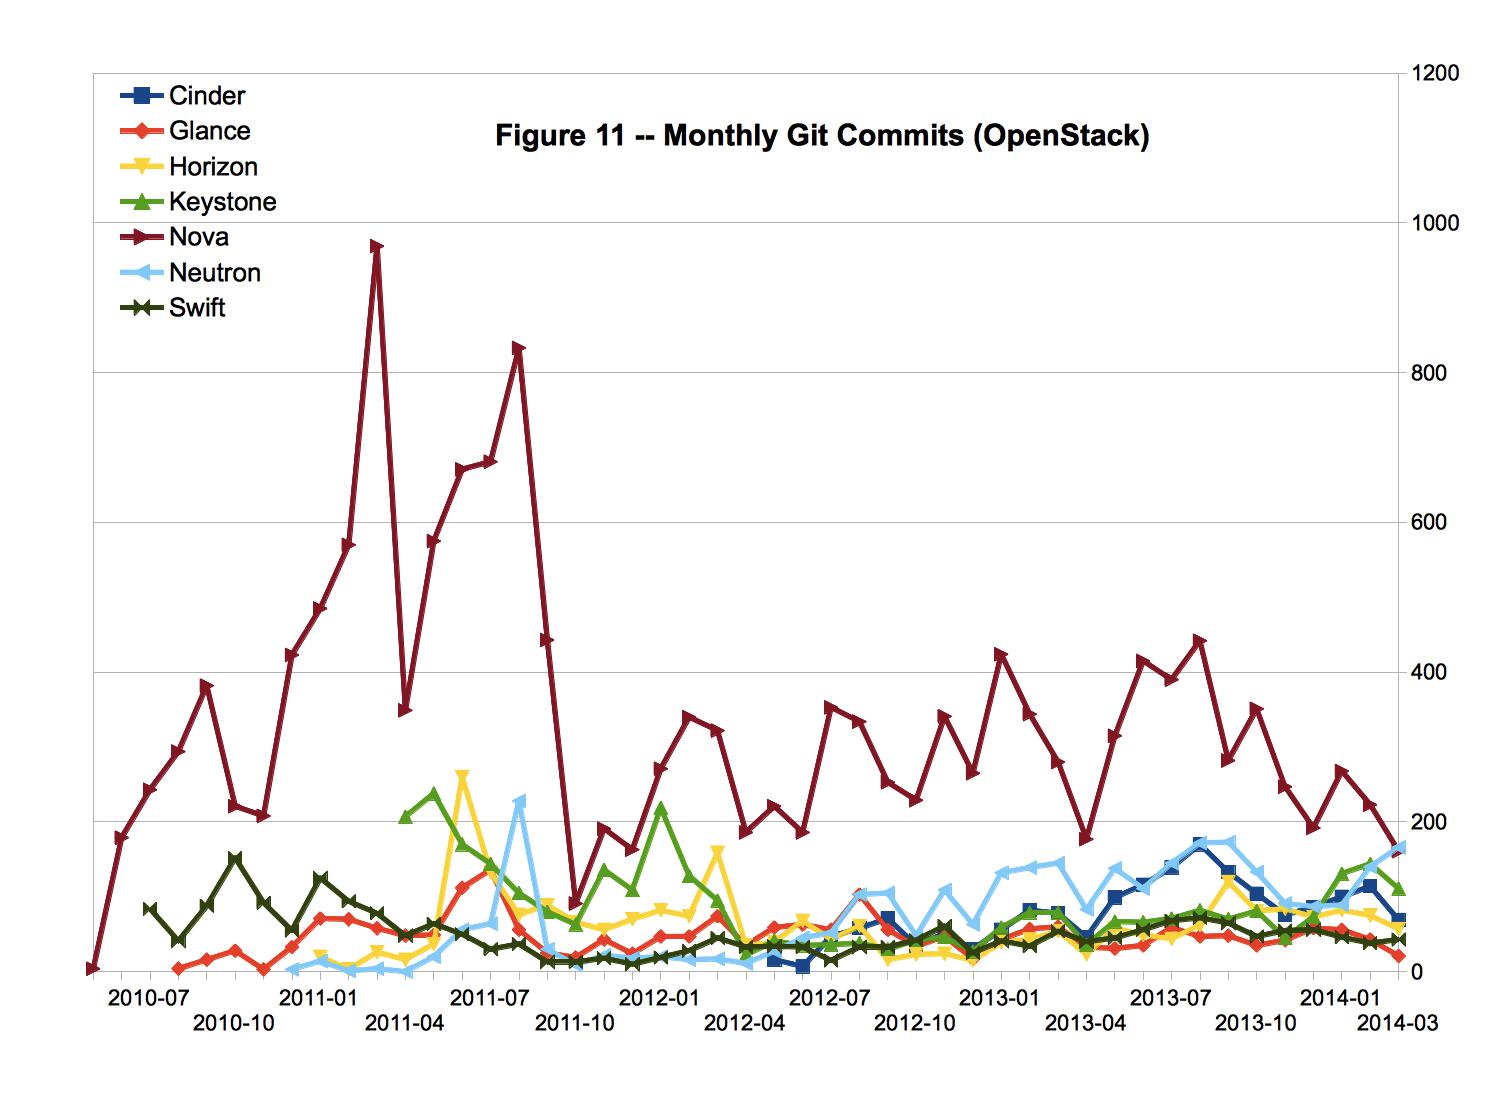
图11所示分别是OpenStack项目中各个子项目目每个月提交代码的次数。总体来看,Nova子项目提交代码的频率较高,是其他几个子项目的三倍左右。值得注意的是,尽管各个子项目提交代码的频率各不相同,但是其时程曲线基本上是一致的,波峰和波谷基本上出现在相同的时间。这个现象表明尽管OpenStack项目中各个子项目相对独立,但是具有相同或者相似的开发计划和开发进度。可以认为,OpenStack项目在子项目的管理和协调方面是做得比较好的。
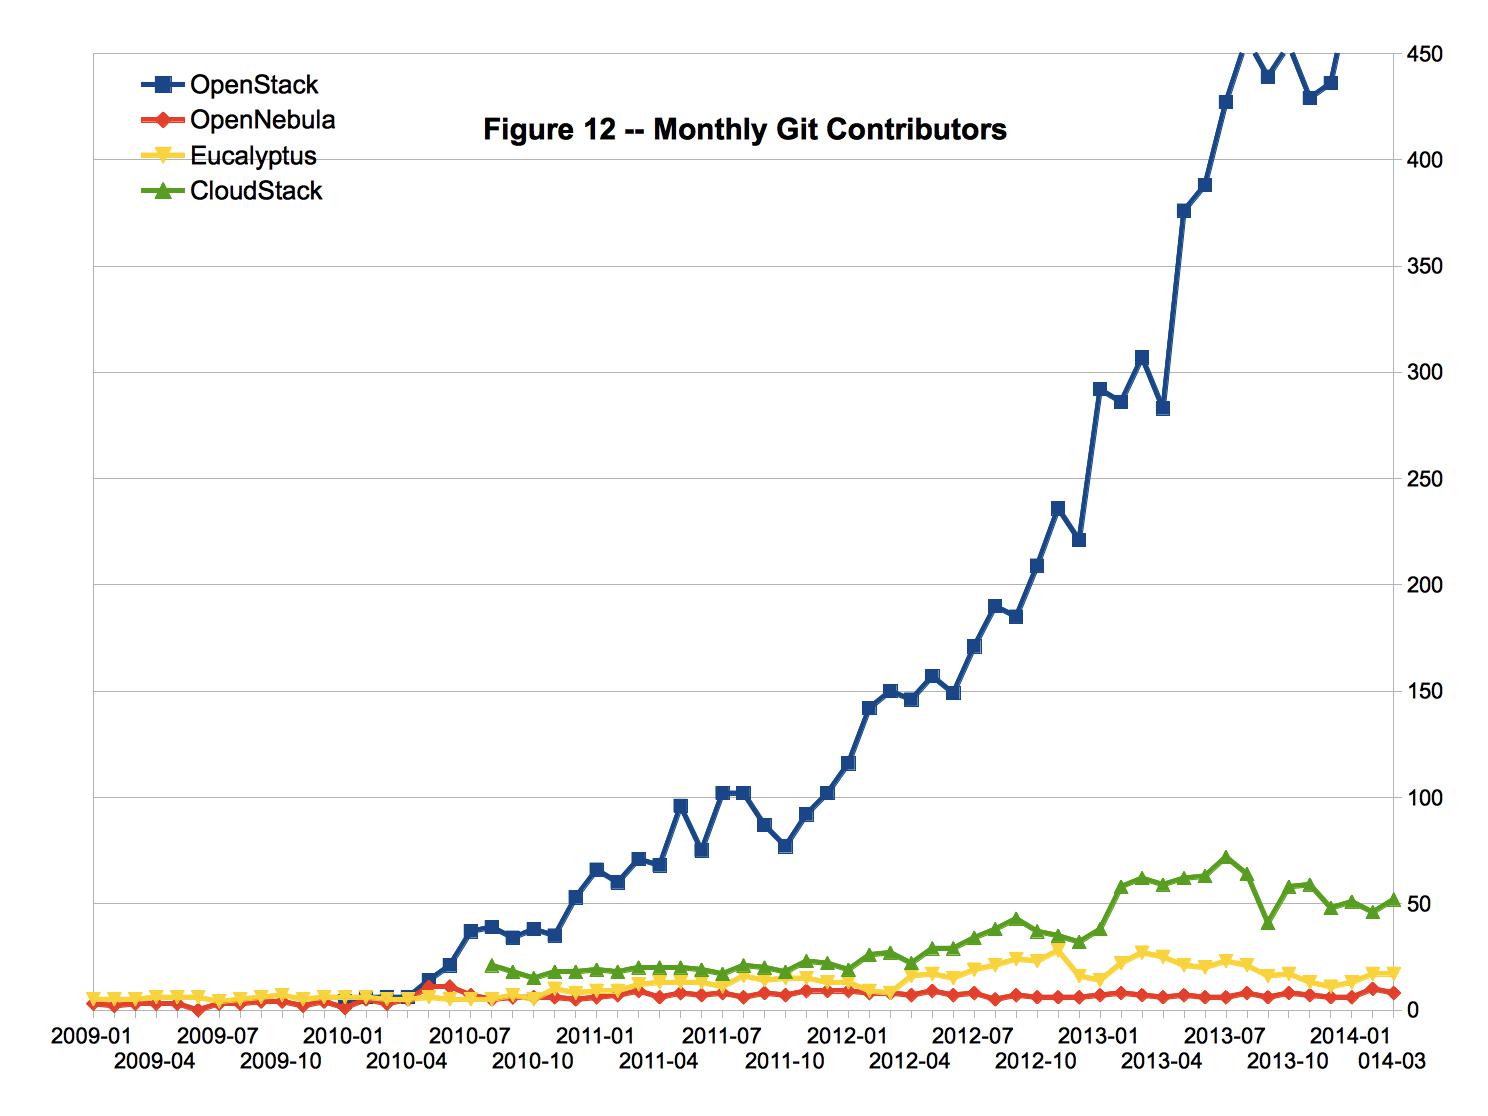
图12所示分别是本文所述四个项目每个月提交代码的人数。总体来看,OpenStack项目提交代码的人数远远超过其他三个项目,并且一直保持迅猛增长的势头。CloudStack项目提交代码的人数也有所增长,但是其增长速度较为缓慢。Eucalyptus项目和OpenNebula项目提交代码的人数相对较少,并且在过去12个月当中基本上没有增长。
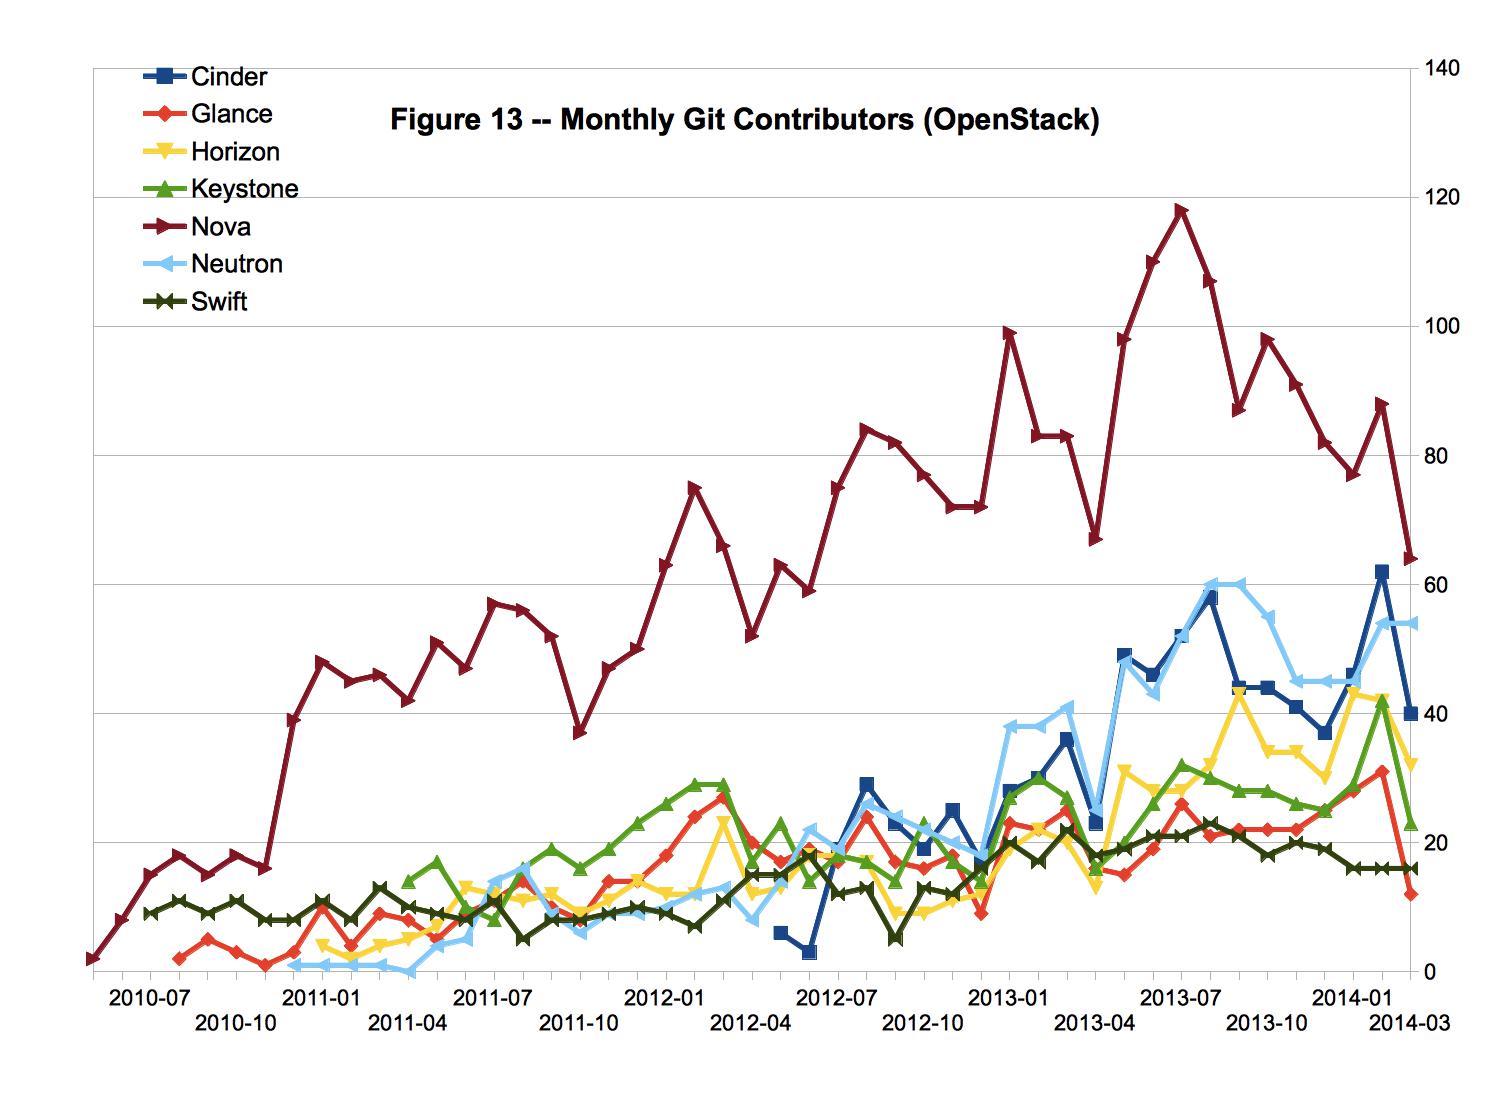
图13所示分别是OpenStack项目中各个子项目每个月提交代码的人数。总体来看,Nova子项目提交代码的人数较多,是其他几个子项目的三倍左右。
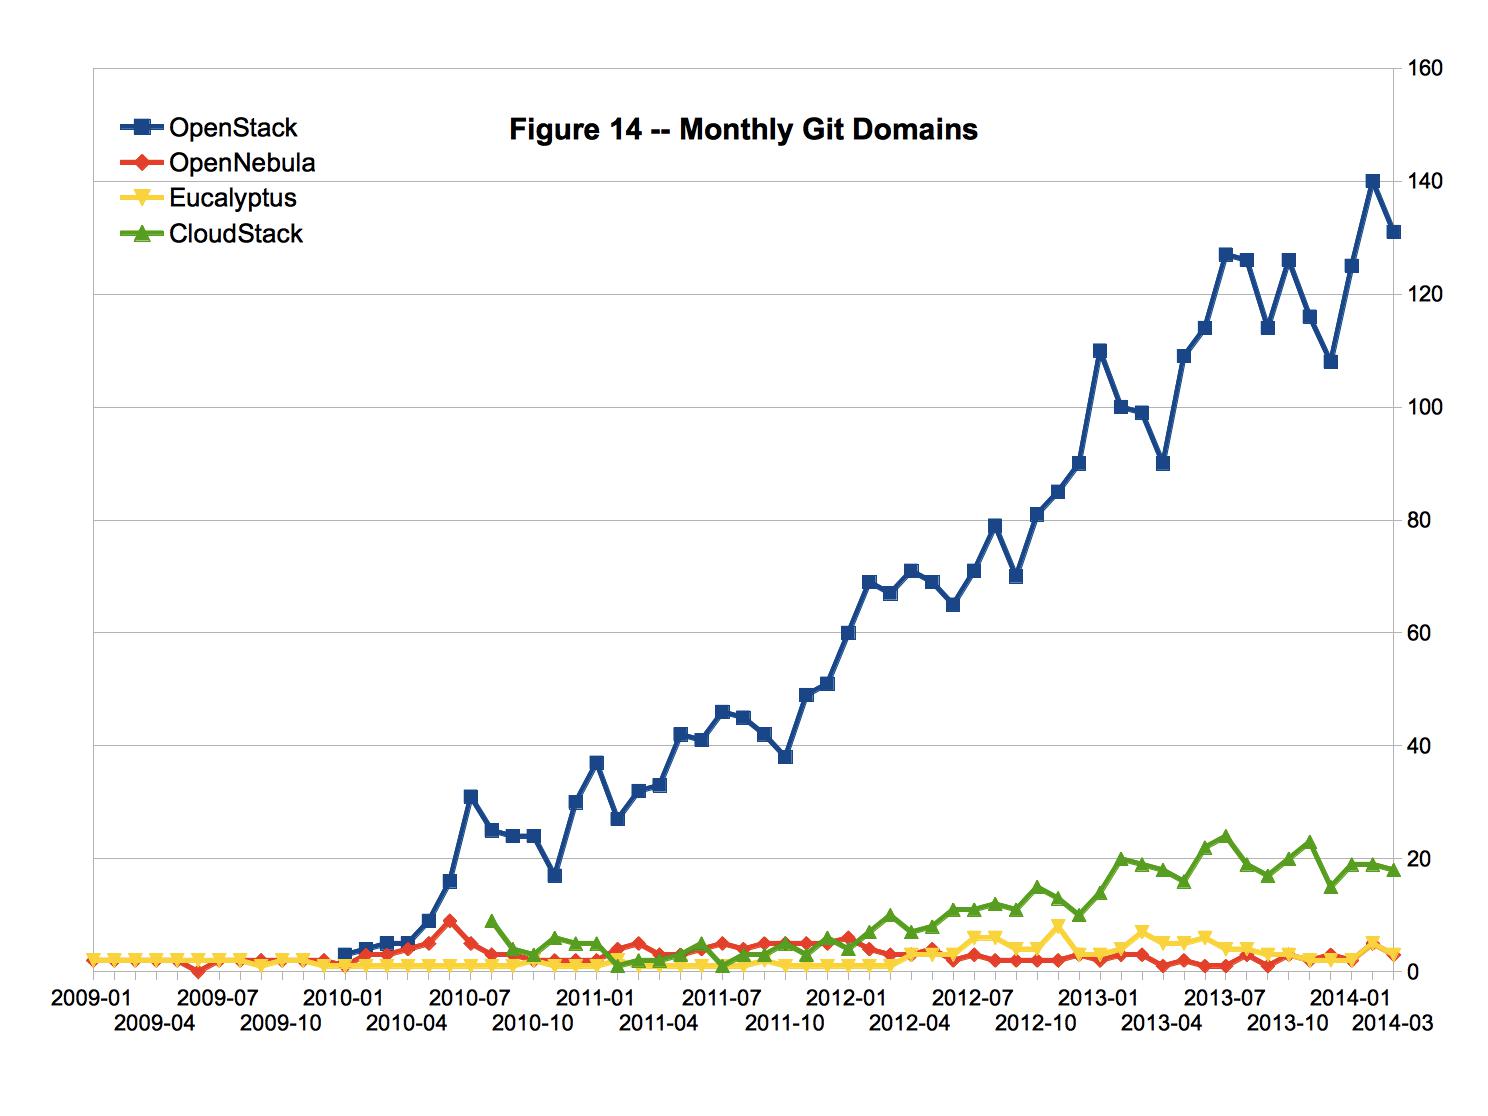
人们通常通过代码贡献者所使用的电子邮件地址来识别其所在的机构。尽管这种方式存在较大的缺陷(例如有一些机构鼓励雇员以个人的名义向开源项目贡献代码),但是还是可以从某种程度上揭示不同机构对某个开源项目的贡献力度。图14所示分别是每个月向本文所述四个项目提交代码(commit操作)的邮件地址所属域名数量。总体来看,OpenStack项目提交代码的域名数量远远超过其他三个项目,并且一直保持迅猛增长的势头。CloudStack项目提交代码的域名数量也有所增长,但是其增长速度较为缓慢。Eucalyptus项目和OpenNebula项目提交代码的域名数量相对较少,并且在过去12个月当中基本上没有增长。
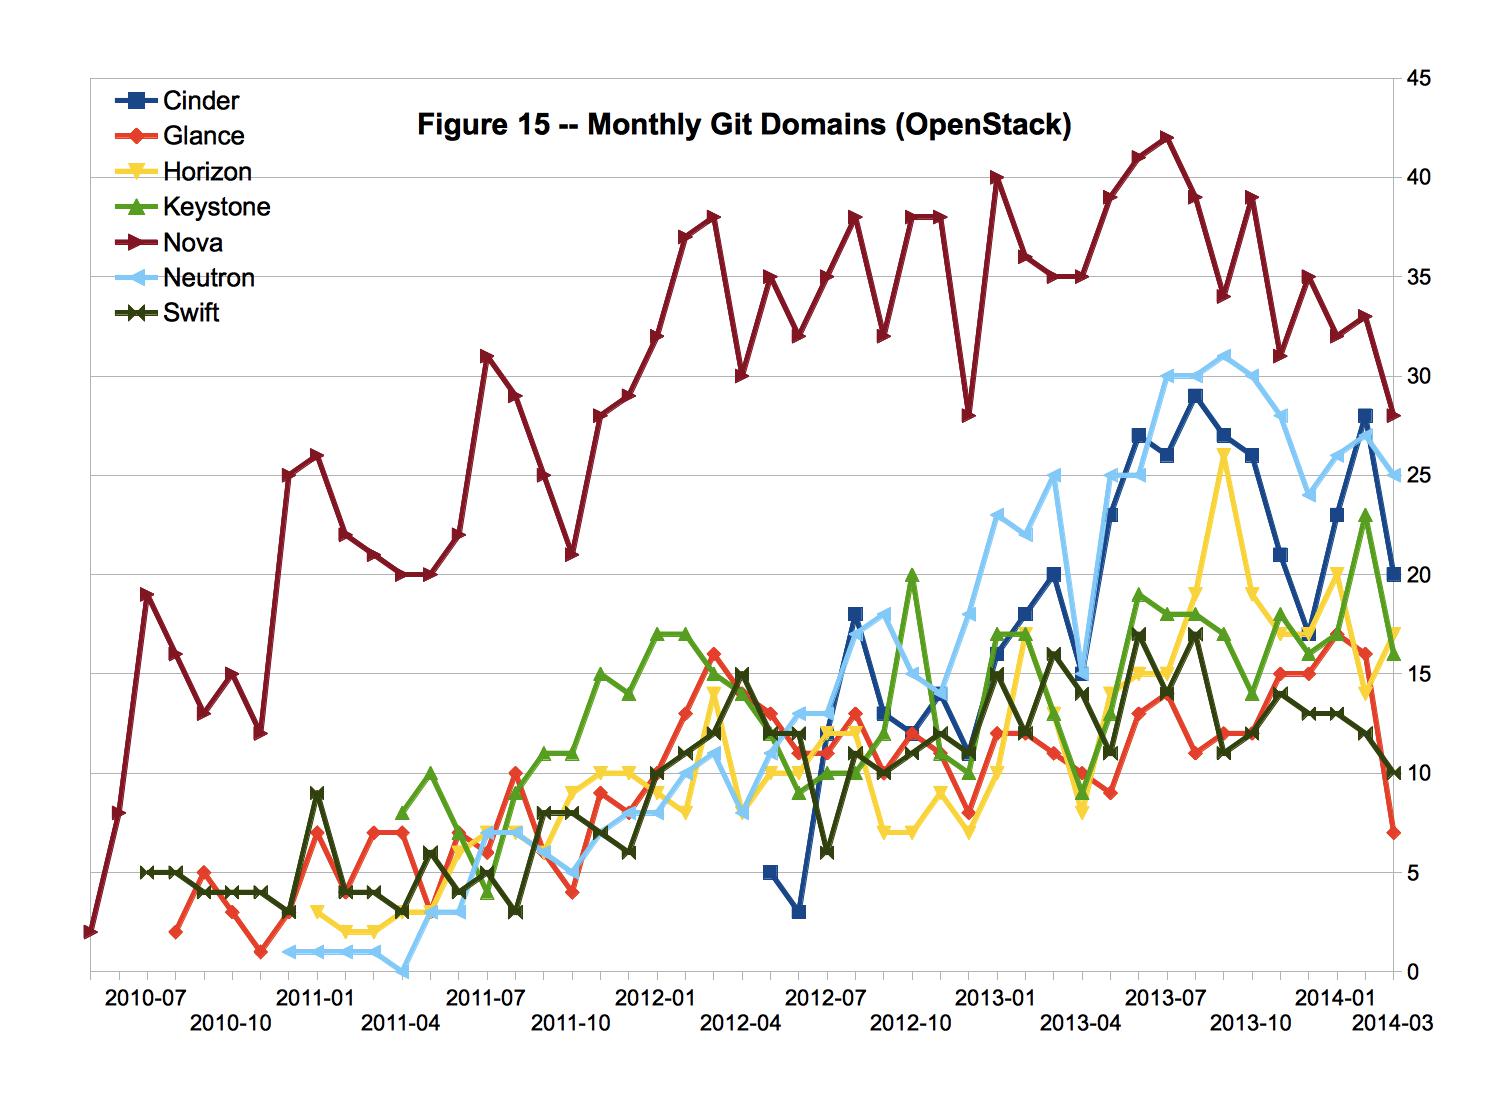
图15所示分别是OpenStack项目中各个子项目每个月提交代码(commit操作)的域名数量。总体来看,Nova子项目提交代码的域名数量较多,是其他几个子项目的三倍左右。
下面这个表格以电子邮件所属域名的形式列出了在CY14-Q1期间向CloudStack、Eucalyptus、OpenNebula和OpenStack项目贡献代码次数最多的机构(以及贡献代码次数的百分比)。可以看出,Eucalyptus和OpenNebula属于以单一机构为主导的开源项目,而CloudStack和OpenStack属于由多家机构共同合作的开源项目。对于CloudStack项目来说,来自Citrix的影响依然非常明显,直接来自citrix.com和cloud.com的邮件地址占了44%(与CY13-Q4相比较上升了3%)。对于OpenStack项目来说,来自RedHat的贡献占了15%,来自IBM的贡献占了11%,随后分别十Mirantis (5%)、Rackspace (4%)、HP (4%)、Suse (3%)、Enovance (2%)和Huawei (1%)。
| CloudStack | Eucalyptus | OpenNebula | OpenStack | ||||
| Domain | % | Domain | % | Domain | % | Domain | % |
| citrix.com | 40 | eucalyptus.com | 80 | opennebula.org | 92 | redhat.com | 15 |
| gmail.com | 19 | gmail.com | 19 | c12g.com | 5 | gmail.com | 15 |
| apache.org | 13 | fedoraproject.org | 1 | cuesoft.eu | 1 | ibm.com | 11 |
| clogeny.com | 5 | openstack.org | 7 | ||||
| shubergphilis.com | 5 | mirantis.com | 5 | ||||
| cloud.com | 4 | rackspace.com | 4 | ||||
| leaseweb.com | 3 | hp.com | 4 | ||||
| netapp.com | 1 | suse.de | 3 | ||||
| betterservers.com | 1 | enovance.com | 2 | ||||
| cloudops.com | 0.6 | huawei.com | 1 | ||||
下面这个表格以电子邮件所属域名的形式列出了在CY14-Q1期间向OpenStack项目各个子项目贡献代码最多的机构(以及贡献代码次数的百分比)。
| Cinder | Glance | Horizon | Keystone | ||||
| Domain | % | Domain | % | Domain | % | Domain | % |
| redhat.com | 16 | ibm.com | 20 | gmail.com | 23 | ibm.com | 27 |
| huawei.com | 12 | gmail.com | 13 | redhat.com | 11 | dstanek.com | 12 |
| gmail.com | 12 | enovance.com | 9 | hp.com | 11 | redhat.com | 10 |
| ibm.com | 9 | mirantis.com | 7 | sheep.art.pl | 10 | metacloud.com | 8 |
| openstack.org | 8 | rackspace.com | 7 | intel.com | 7 | gmail.com | 7 |
| solidfire.com | 7 | huawei.com | 6 | da.jp.nec.com | 5 | dreamhost.com | 5 |
| netapp.com | 4 | dmllr.de | 5 | mirantis.org | 4 | openstack.org | 3 |
| hp.com | 4 | yahoo.com | 5 | openstack.org | 3 | huawei.com | 3 |
| ebaysf.com | 2 | hp.com | 3 | enovance.com | 3 | hp.com | 2 |
| dmllr.de | 2 | openstack.org | 2 | cloudwatt.com | 2 | mirantis.com | 2 |
| Nova | Neutron | Swift | |||||
| Domain | % | Domain | % | Domain | % | ||
| ibm.com | 21 | gmail.com | 17 | swiftstack.com | 25 | ||
| redhat.com | 20 | openstack.org | 14 | redhat.com | 18 | ||
| gmail.com | 11 | mirantis.com | 10 | gmail.com | 17 | ||
| vmware.com | 6 | nicira.com | 6 | enovance.com | 8 | ||
| rackspace.com | 5 | redhat.com | 5 | not.mn | 6 | ||
| hp.com | 4 | ibm.com | 4 | brim.net | 4 | ||
| intel.com | 3 | da.jp.nec.com | 4 | kotori.zaitcev.us | 3 | ||
| huawei.com | 2 | cisco.com | 3 | rackspace.com | 2 | ||
| stillhq.com | 2 | unitedstack.com | 3 | hgst.com | 2 | ||
| openstack.org | 2 | hp.com | 2 | intel.com | 1 | - | — |
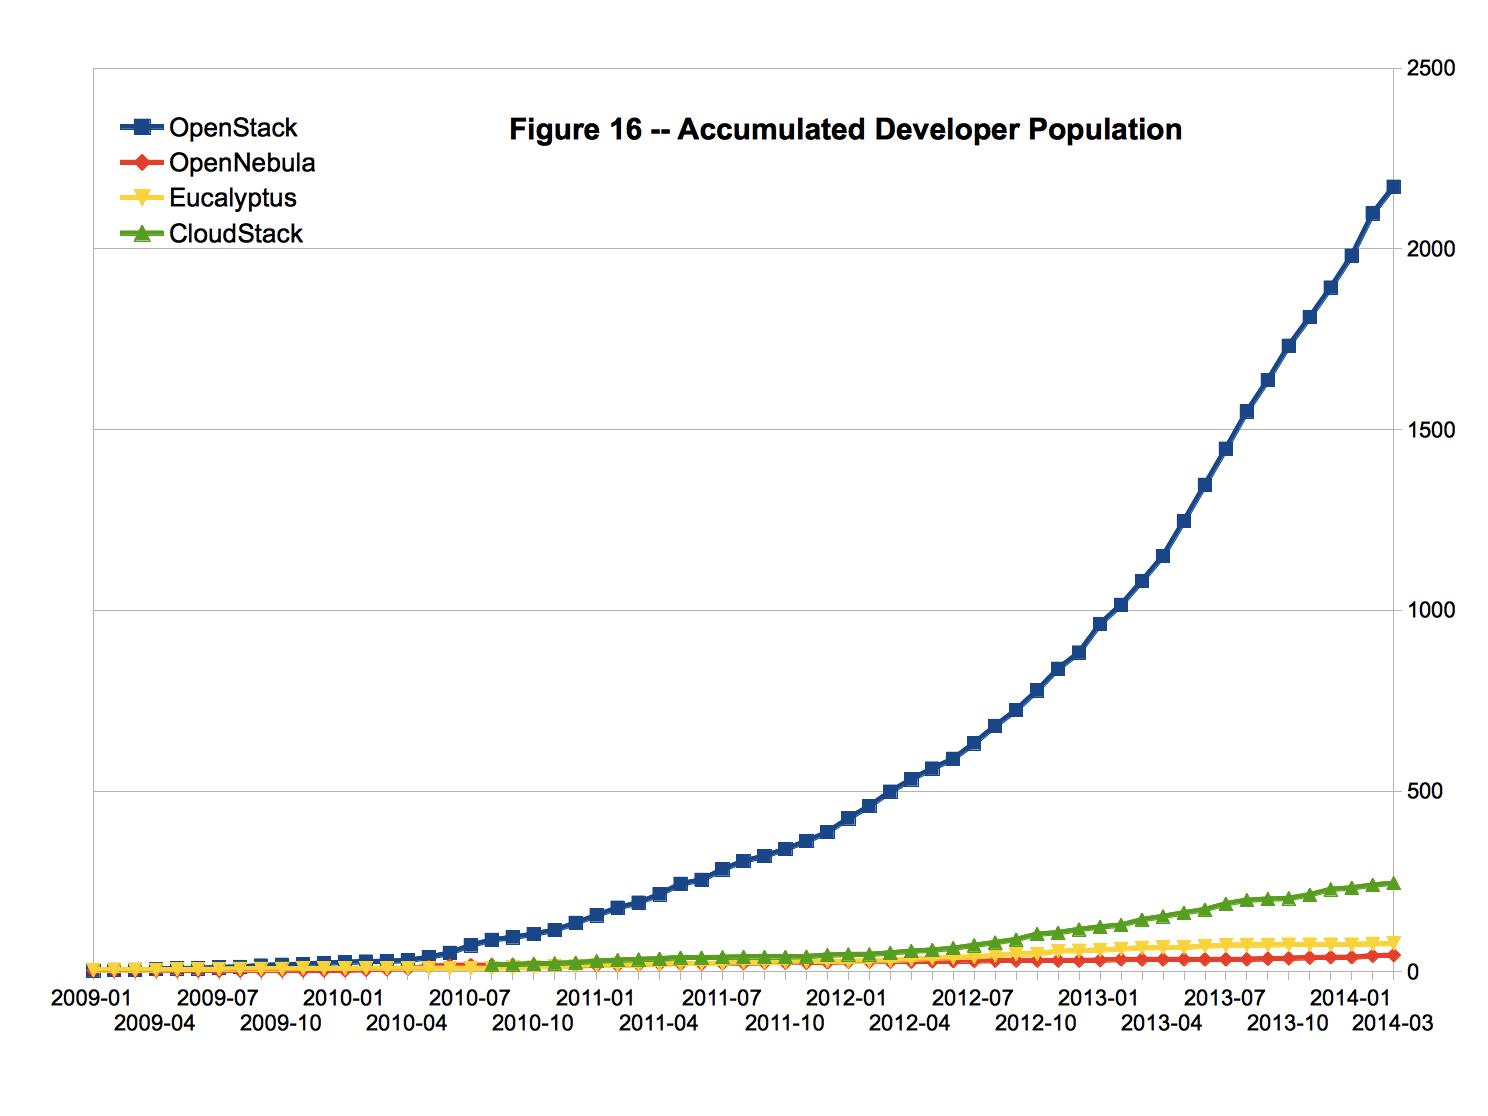
累计开发者人口指的是曾经向某个项目提交过代码的开发者总数。图16所示为这四个项目的开发者人口增长趋势。可以看出,OpenStack项目的累计开发者人口最大,是第二名CloudStack的10倍左右。
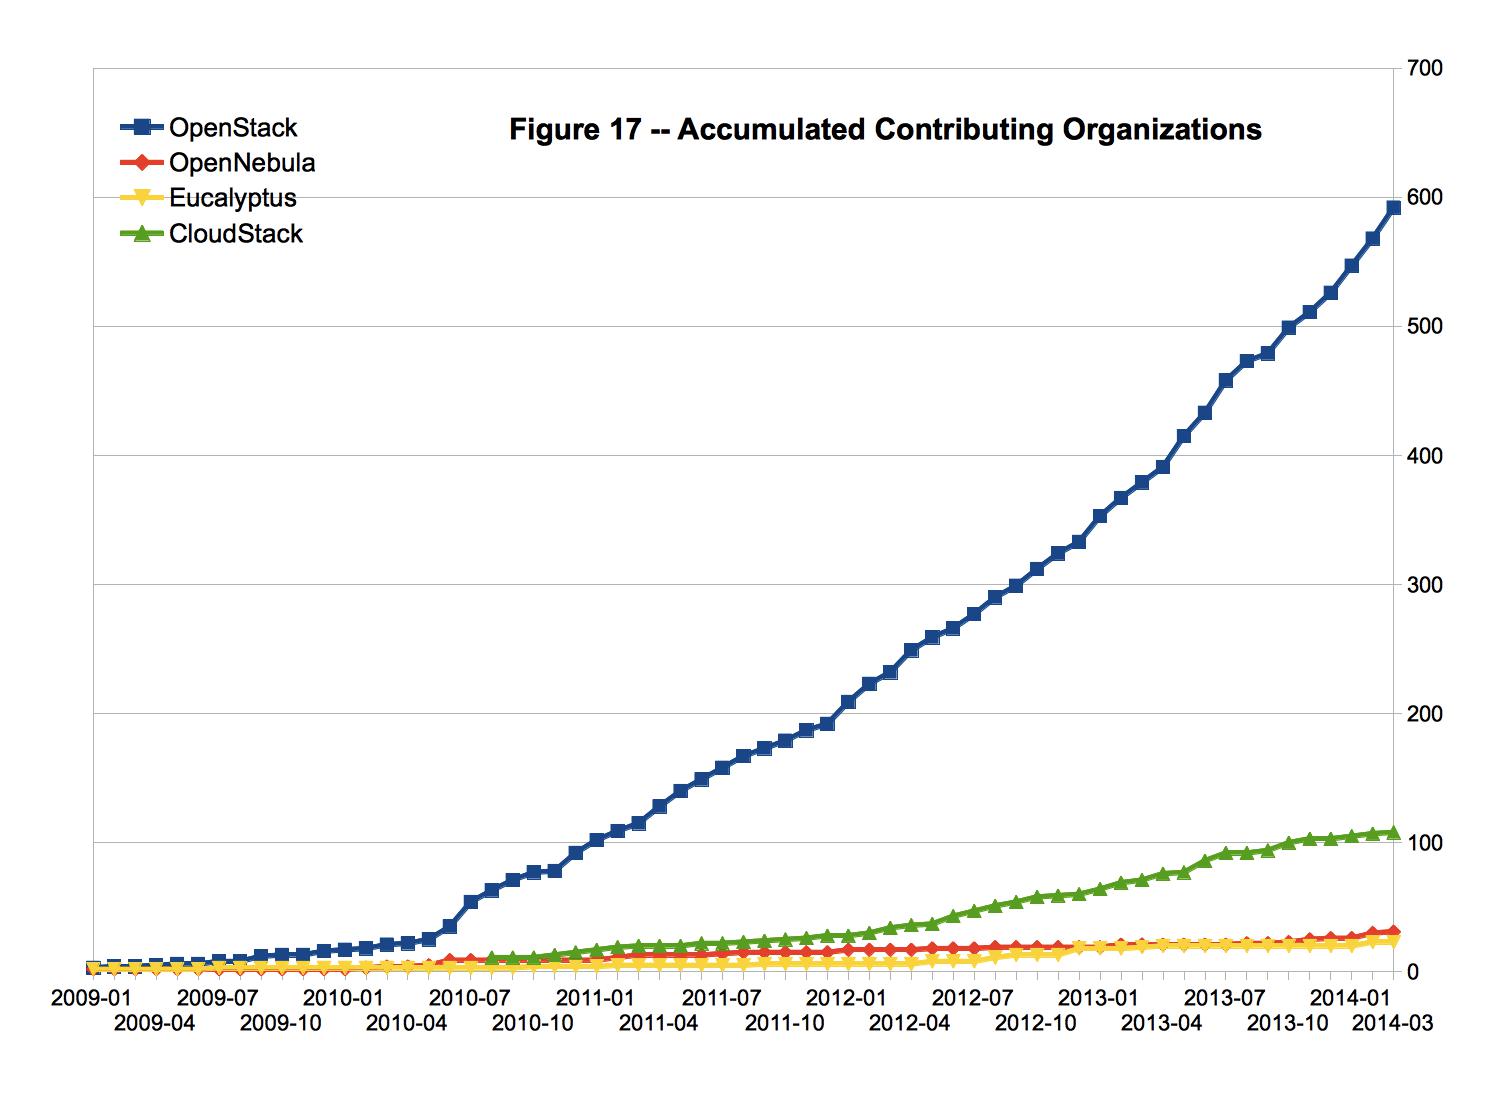
累计贡献机构数量指的是曾经向某个项目提交过代码的机构数量。图16所示为这四个项目的累计贡献机构数量增长趋势。可以看出,OpenStack项目的累计贡献机构数量最多,是CloudStack和Eucalyptus的5倍左右。OpenNebula的累计贡献机构数量相对较少。
与本文相关的PDF版本幻灯片可以从<https://media.qyjohn.net/wp-content/uploads/2014/04/CY14-Q1-IaaS-Community-Analysis.pdf">这里下载。如果您需要重新分发本文内容,敬请您保留相关作者信息。
CY14-Q1 Community Analysis — OpenStack vs OpenNebula vs Eucalyptus vs CloudStack
| 发表时间:2014-04-14 15:46:43 | 评论:1 |
This article is an update version of my previous article CY13-Q4 Community Analysis — OpenStack vs OpenNebula vs Eucalyptus vs CloudStack. Readers who are intested in further discussions please contact me via email at the above-mentioned address.
A Chinese version of this article is published at the same time, which can be found at CY14-Q1 OpenStack, OpenNebula, Eucalyptus, CloudStack社区活跃度比较.
This community analysis project was initiated in CY11-Q4, and this particular report is the 10th quarterly report being published since. The opinion presented in this report belongs strictly to the author rather than any current or previous employer of the author.
The objective of this quarterly report is to compare the OpenStack, OpenNebula, Eucalytpus and CloudStack user and developer communities, base on the communications between community members in the form of mailing lists or pubic forum discussions. The data being discussed include the total number of topics (threads), messages (posts), and participants (unique email addresses or registered members). To obtain the above-mentioned data, a Java program was written to retrieve all the forum posts and mailing list messages into a MySQL database for further processing. The analysis results were presented in the form of graphs generated by LibreOffice.
Eucalyptus EOL'ed its technical support forum (engage) during this quarter, and direct all user discussions to its google group. This produces a significant impact on its discussion traffic.
During the past several years, some of the early forums and mailing lists became EOL’ed and were no longer accessible. The MySQL database that was built at the beginning of this project, as well as the previous versions of this quarterly report, make it possible to carry out analysis since the beginning of each project.
For projects with multiple membership systems (such as a forum and a mailing list), extensive efforts were carried out to eliminate membership double counting (counting one person twice or more in the statistics).
Figure 1 and 2 represent the monthly number of topics (threads) and posts (messages). It can be seen that
(1) During the past 12 months, OpenStack-related discussions and CloudStack-related discussions were approximately on the same level, while Eucalyptus-related discussions and OpenNebula-related discussions were approximately on the same level.
(2) During the past 12 months, the volume of OpenStack and CloudStack related discussions were much higher than that of Eucalyptus and OpenNebula.
Generally speaking, the number of replies to a specific topic represents the attention being received, and the depth of discussion for that particular topic. When the number of master posts (the original post that started a particular topic) is more than the number of replies, it is safe to conclude that the participation of the forum or mailing list is very low. Therefore, the ratio between “the number of posts” and “the number of topics” represents the participation rate of an online community. In this study we call this ratio the Participation Ratio.
As can be seen from Figure 3, during the past 12 months the participation ratios of CloudStack and Eucalyptus were relatively higher, which were close to 4; the participation ratios of OpenStack and OpenNebula were relatively lower, which were a little bit higher than to 2.
We do notice that the concept of “participation ratio” generated some disagreements. Some people think that a lower “post-to-thread ratio” represents the ability to resolve problems in a very short time, therefore only a very limited number of discussions are needed. Some people think that a higher “post-to-thread ratio” might be an indicator that the community are on flame, and during a flame a large portion of the posts might be off-topic. Anyway, we agree that when we call this parameter “participation ratio” it somewhat represents our own opinion and it undermines the objectiveness of this report. However, because we do not find a better name to represent this parameter, we will just use it for the time being. (Dear readers, you are more than welcome to contribute a better name for this parameter.)
Figure 4 shows the number of monthly participants of the four projects being discussed. It can be seen that the number of active participants of OpenStack is much higher than the other three projects. The number of active participants of CloudStack is also significantly higher than OpenNebula and Eucalyptus. During the past 12 months, the number of active participants for OpenStack and CloudStack were growing steadily (100% growth for OpenStack, and 50% growth for CloudStack), while the number of active participants for Eucalyptus and OpenNebula exhibited no significant growth.
It should be noted that although the number of active participants of the CloudStack project is somewhat smaller than that of the OpenStack project, both projects have approximately the same amount of discussions (as shown in Figure 1 and Figure 2).
Accumulated Community Population refers to the total number of users and developers who have participated in forum or mailing list discussions. (This number does not include those who have registered into discussion forums or mailing lists but have never participated in any open discussions.) These are people who have tested or used a specific product for a while, but not necessary currently an active user.
Figure 5 shows the growth of the accumulated community populations of these 4 projects. Currently OpenStack has the larges accumulated community population, followed by Eucalyptus, CloudStack, and OpenNebule.
The problem is, after years of changes, a long-term (such as 4 to 5 years) accumulated community population might not be a good reference for community activeness. Some of the early members of one community might have switched to other communities (and probably more than once), some of the early community medium (such as mailing lists and forums) might have become EOL’ed. From a community analysis point of view, it might be better to count the accumulated community population of the past 6 to 12 months, while extending the range to the dinosaurs age will make this parameter meaningless.
We are seeing increasing number of suggestions to analyze the git activities of these open source IaaS projects. We also noticed that all of these four projects use git as the SVM for their source code. Starting from our CY13-Q1 report, we tried to do some basic analysis base on the git log data. It should be noted that for the OpenStack project, the data source includes all the sub-projects under openstack (57 sub-projects) and openstack-infra (33 sub-projects) on github.com.
In our CY13-Q1 report, we used “git log” to obtain log information. Starting from CY13-Q2, we will use “git log –no-merges” to obtain log information.
It should be pointed out that git is a distributed versioning system. With git, developers work with their own local repositories. When a developer executes a commit operation, the code changes are make to the local repositories, and will not be reflected in the master repository until such commits are pushed to and merged with the master repository. It is common practice that developers tend to accumulate many commits before they feel comfortable to make a push. Therefore, some of the recent commits might not get counted towards this analysis. Based on our observations, there exists about 50% under estimation in the number of commits for the previous month, and about 20% under estimation in the number of commits for the month before.
Figure 10 shows the monthly number of commit operations for these four projects. Generally speaking, the commit frequency of OpenStack is much higher than the commit frequencies of the other three projects. This is because the data source for OpenStack includes a total number of 90 sub-projects, which is far greater than the other three projects. The commit frequency of CloudStack is also significantly higher than Eucalyptus and OpenNebula. As compared to OpenNebula, Eucalyptus was also committing more frequently, but with significant fluctuations from month to month, which seems to be a typical batch-commit behavior. The commit frequency of the OpenNebula project is relatively small, with an average of 200 commits per month.
Figure 11 shows the monthly number of commit operations for the sub-projects of OpenStack. Generally speaking, the commit frequency of the Nova sub-project is about 3 times as high as the other sub-projects. It should be noted that although the commit frequency of these sub-projects are different, but they exhibit similar time-series curves, and their highs and lows occur at the same period of time. This indicates that although these sub-projects are relatively independent, but they work around the same development plan and the same release schedule. This is an indicator that the OpenStack project is well organized in terms of sub-project management.
Figure 12 shows the monthly number of contributors (identified by unique email addresses) for these projects. Generally speaking, the number of OpenStack contributors is much higher than the other three projects, and is growing rapidly. The number of CloudStack contributors also exhibits some growth, but the growth is relatively slow. The number of Eucalyptus and OpenNebula contributors is relatively small, and does not exhibit growth during the past 12 months.
Figure 13 shows the monthly number of contributors (identified by unique github.com accounts) for the sub-projects of OpenStack. It can be seen that the number of Nova contributors is about 3 times as big as the other sub-projects.
People usually try to identify the institute to which a contributor belongs to by his/her email address. It is true that such method is defect in nature (different institutes have different policies regarding contributing to open source projects, some institutes even encourage their employees to contribute to open source projects with their personal account), but still this parameter can be used to show the contributions of certain institutes to certain open source projects. Figure 14 shows the monthly number of unique institutes (identified by the domain name of the contributor’s email address) contributing to these projects. We can see that the number of contributing institutes for OpenStack is much larger than the other three projects, and is growing rapidly. The number of contributing institutes for CloudStack is also growing, but at a relatively slow pace. The number of contributing institutes to Eucalyptus and OpenStack is relatively small, and does not exhibit any growth during the past 12 months.
Figure 15 shows the monthly number of contributing institutes to the sub-projects of OpenStack. It can be seen that the number of contributing institutes for Nova is about 3 times as big as the other sub-projects.
The following table lists those institutes that make the most contributions to these projects during CY14-Q1, according to the number of commit operations, along with the percentage of their commit operations. It can be seen that both Eucalyptus and OpenNebula are open source projects dominated by single institutes, while CloudStack and OpenStack are open source projects contributed by multiple institutes. For the CloudStack projects, influence from Citrix is still quite obvious, over 44% of the commits come from accounts belonging to citrix.com and cloud.com (3% increase as compared to CY13-Q4). For the OpenStack project, redhat.com contributed to 15% of the commits, while ibm.com contributed 11% of the commits, followed by mirantis.com (5%), rackspace.com (4%), hp.com (4%), suse.de (3%), enovance.com ( 2%), and huawei.com (1%).
| CloudStack | Eucalyptus | OpenNebula | OpenStack | ||||
| Domain | % | Domain | % | Domain | % | Domain | % |
| citrix.com | 40 | eucalyptus.com | 80 | opennebula.org | 92 | redhat.com | 15 |
| gmail.com | 19 | gmail.com | 19 | c12g.com | 5 | gmail.com | 15 |
| apache.org | 13 | fedoraproject.org | 1 | cuesoft.eu | 1 | ibm.com | 11 |
| clogeny.com | 5 | openstack.org | 7 | ||||
| shubergphilis.com | 5 | mirantis.com | 5 | ||||
| cloud.com | 4 | rackspace.com | 4 | ||||
| leaseweb.com | 3 | hp.com | 4 | ||||
| netapp.com | 1 | suse.de | 3 | ||||
| betterservers.com | 1 | enovance.com | 2 | ||||
| cloudops.com | 0.6 | huawei.com | 1 | ||||
The following table lists those institutes that make the most contributions to the sub-projects of OpenStack during CY14-Q1, along with the percentage of their commit operations.
| Cinder | Glance | Horizon | Keystone | ||||
| Domain | % | Domain | % | Domain | % | Domain | % |
| redhat.com | 16 | ibm.com | 20 | gmail.com | 23 | ibm.com | 27 |
| huawei.com | 12 | gmail.com | 13 | redhat.com | 11 | dstanek.com | 12 |
| gmail.com | 12 | enovance.com | 9 | hp.com | 11 | redhat.com | 10 |
| ibm.com | 9 | mirantis.com | 7 | sheep.art.pl | 10 | metacloud.com | 8 |
| openstack.org | 8 | rackspace.com | 7 | intel.com | 7 | gmail.com | 7 |
| solidfire.com | 7 | huawei.com | 6 | da.jp.nec.com | 5 | dreamhost.com | 5 |
| netapp.com | 4 | dmllr.de | 5 | mirantis.org | 4 | openstack.org | 3 |
| hp.com | 4 | yahoo.com | 5 | openstack.org | 3 | huawei.com | 3 |
| ebaysf.com | 2 | hp.com | 3 | enovance.com | 3 | hp.com | 2 |
| dmllr.de | 2 | openstack.org | 2 | cloudwatt.com | 2 | mirantis.com | 2 |
| Nova | Neutron | Swift | |||||
| Domain | % | Domain | % | Domain | % | ||
| ibm.com | 21 | gmail.com | 17 | swiftstack.com | 25 | ||
| redhat.com | 20 | openstack.org | 14 | redhat.com | 18 | ||
| gmail.com | 11 | mirantis.com | 10 | gmail.com | 17 | ||
| vmware.com | 6 | nicira.com | 6 | enovance.com | 8 | ||
| rackspace.com | 5 | redhat.com | 5 | not.mn | 6 | ||
| hp.com | 4 | ibm.com | 4 | brim.net | 4 | ||
| intel.com | 3 | da.jp.nec.com | 4 | kotori.zaitcev.us | 3 | ||
| huawei.com | 2 | cisco.com | 3 | rackspace.com | 2 | ||
| stillhq.com | 2 | unitedstack.com | 3 | hgst.com | 2 | ||
| openstack.org | 2 | hp.com | 2 | intel.com | 1 | ————————- | — |
Accumulated Developer Population refers to the total number of developers who have contributed code to a particular project (as reflected in git commits). Figure 16 shows the growth of the accumulated developer populations of these 4 projects. Currently OpenStack has the largest accumulated developer population, which is about 10 times bigger than the distant number 2 CloudStack.
Accumulated Contributing Organizations refers to the total number of organizations (as reflected in unique domain names associated with developer email addresses) who have contributed code to a particular project (as reflected in git commits). Figure 17 shows the growth of the accumulated contributing organizations of these 4 projects. Currently OpenStack has the largest number of contributing organizations, which is 5 times larger than CloudStack and Eucalyptus. OpenNebula has the smallest number of contributing organizations.
For your convenience, a PDF version of this presentation can be downloaded from here. Please kindly keep the author information if you want to redistribute the content.
A Side Note:
My family recently relocated from China to Australia. I am currently located in Sydney, with full-time employment permissions. I am looking for job opportunities in Sydney, preferably related to cloud computing. I am an AWS Certified Solutions Architect (Associate Level), and an AWS Certified Developer (Associate Level), with extensive hands-on experience working with various private and pubic cloud platforms. I am particular strong in market analysis, technology evangelism, as well as customer facing technical services. You can refer to my LinkedIn profile for details about my professional experiences, as well as comments from my previous employers. You can always reach me via email (qjiang@ieee.org) for a discussion.
Data Source on the Economics of Computing Resource Market
| 发表时间:2014-04-02 18:22:23 | 评论:1 |
This blog post is created to provide additional reference materials for "Infrastructure-as-a-Service from a Business and Energy Consumption Perspective", an article authored by Qingye Jiang, Young Choon Lee, and Albert. Y. Zomaya at the School of Information Technologies in the University of Sydney.
A wide range of data sources are utilized to facilitate this research, including Gartner’s quarterly reports on worldwide server shipments, AWS official blog entries regarding price deduction and resource usage, Rackspace’s annual financial reports, performance and power consumption parameters from the Top500 supercomputer list, as well as some other web pages and public accessible presentations. The majority of these data sources are not in the form of a peer-reviewed academic article, but in the form of a public accessible URL. Since the amount of URL’s to be referred to would overwhelm the limited references list, we created this dedicated blog entry, with links to all the data sources being used in this article. The authors will also update this blog entry as new data source related to the topic becomes available, which will be helpful for further researches on similar subjects.
[Gartner Quarterly Report on Worldwide Server Shipments]
2006-Q1:
http://www.gartner.com/newsroom/id/493001
2006-Q2:
http://www.gartner.com/newsroom/id/495891
2006-Q3:
http://www.gartner.com/newsroom/id/498468
2006-Q4:
http://www.gartner.com/newsroom/id/501405
2007-Q1:
http://www.gartner.com/newsroom/id/506336
2007-Q2:
http://www.gartner.com/newsroom/id/513509
2007-Q3:
http://www.gartner.com/newsroom/id/550315
2007-Q4:
http://www.gartner.com/newsroom/id/608710
2008-Q1:
http://www.gartner.com/newsroom/id/713321
2008-Q2:
http://www.gartner.com/newsroom/id/745516
2008-Q3:
http://www.gartner.com/newsroom/id/823712
2008-Q4:
http://www.gartner.com/newsroom/id/905914
2009-Q1:
http://www.gartner.com/newsroom/id/1000326
2009-Q2:
http://www.gartner.com/newsroom/id/1161313
2009-Q3:
http://www.gartner.com/newsroom/id/1238521
2009-Q4:
http://www.gartner.com/newsroom/id/1307717
2010-Q1:
http://www.gartner.com/newsroom/id/1375038
2010-Q2:
http://www.gartner.com/newsroom/id/1426834
2010-Q3:
http://www.gartner.com/newsroom/id/1479923
2010-Q4:
http://www.gartner.com/newsroom/id/1561014
2011-Q1:
http://www.gartner.com/newsroom/id/1700715
2011-Q2:
http://www.gartner.com/newsroom/id/1776714
2011-Q3:
http://www.gartner.com/newsroom/id/1859415
2011-Q4:
http://www.gartner.com/newsroom/id/1935717
2012-Q1:
http://www.gartner.com/newsroom/id/2031115
2012-Q2:
http://www.gartner.com/newsroom/id/2139315
2012-Q3:
http://www.gartner.com/newsroom/id/2254815
2012-Q4:
http://www.gartner.com/newsroom/id/2351518
2013-Q1:
http://www.gartner.com/newsroom/id/2497015
2013-Q2:
http://www.gartner.com/newsroom/id/2580515
2013-Q3:
http://www.gartner.com/newsroom/id/2632515
2013-Q4:
http://www.gartner.com/newsroom/id/2671315
[AWS Price Deduction History, S3 Growth, and EC2 Server Growth]
2008-10-09
http://aws.typepad.com/aws/2008/09/new-release-of.html
2009-10-27
http://aws.typepad.com/aws/2009/10/amazon-ec2-now-an-even-better-value.html
2009-12-08
http://aws.typepad.com/aws/2009/12/aws-price-reductions.html
2010-11-01
http://aws.typepad.com/aws/2010/11/what-can-i-say-another-amazon-s3-price-reduction.html
2012-02-06
http://aws.typepad.com/aws/2012/02/amazon-s3-price-reduction.html
2012-03-05
http://aws.typepad.com/aws/2012/03/dropping-prices-again-ec2-rds-emr-and-elasticache.html
2012-10-31
http://aws.typepad.com/aws/2012/10/new-ec2-second-generation-standard-instances-and-price-reductions-1.html
2012-11-29
http://aws.typepad.com/aws/2012/11/amazon-s3-price-reduction-december-1-2012.html
2013-02-01
http://aws.typepad.com/aws/2013/02/ec2s-m3-global-reduced-ec2-bandwidth.html
2013-11-05
http://aws.typepad.com/aws/2013/11/prices-reduced-for-ec2s-m3-second-generation-standard-instances.html
2014-01-21
http://aws.typepad.com/aws/2014/01/aws-update-new-m3-features-reduced-ebs-prices-reduced-s3-prices.html
2012-04-05
http://aws.typepad.com/aws/2012/04/amazon-s3-905-billion-objects-and-650000-requestssecond.html
2013-04-18
http://gigaom.com/2013/04/18/amazon-s3-goes-exponential-now-stores-2-trillion-objects/
[Rackspace Financial and Server Data]
2009:
http://www.getfilings.com/sec-filings/100226/RACKSPACE-HOSTING-INC_10-K/
2011:
http://www.sec.gov/Archives/edgar/data/1107694/000110769412000010/rax1231201110-k.htm
2012:
http://www.sec.gov/Archives/edgar/data/1112920/000119312513132408/d446382d10k.htm
2013:
http://biz.yahoo.com/e/140303/rax10-k.html
[SoftLayer Financial and Server Data]
SoftLayer Company Overview (2009.12):
http://www.slideshare.net/SoftLayer/softlayer-company-overview
SoftLayer Media Kit (2009 Q1)
http://www.slideshare.net/SoftLayer/soft-layer-q109-media-kit
SoftLayer Presentation for Telx Cbx (2010.06)
http://www.slideshare.net/SoftLayer/softlayer-overview-for-telx-cbx-jun10-final
SoftLayer Presentation at Stifel Nicolaus Event (2011.02)
http://www.slideshare.net/SoftLayer/softlayer-presentation-at-stifel-nicolaus-event-feb-10-2011-vfinal
SoftLayer Presentation (2012.06)
http://www.slideshare.net/IngramMicroNL/softlayer-iaas-22-juni-2012
[CERN Computing Center and LHC Grid]
CERN Agile Infrastructure - Road to Production
http://www.slideshare.net/traylenator/cern-agile-infrastructure-road-to-production
CERN Infrastructure Evolution V2
http://www.slideshare.net/noggin143/20120524-cern-data-centre-evolution-v2
OpenStack in Production
http://openstack-in-production.blogspot.ch/2013/09/a-tale-of-3-openstack-clouds-50000.html
Operating Dedicated Data Centers - Is It Cost-Effective?
http://indico.cern.ch/event/247864/material/slides/0?contribId=60&sessionId=1
[NASA JPL]
Making IT Rain with Cloud Computing
http://www.slideshare.net/NASAPMC/shamskhawaja
[Estimations on the Size of AWS]
http://www.cloudscaling.com/blog/cloud-computing/amazons-ec2-generating-220m-annually/
http://huanliu.wordpress.com/2012/03/13/amazon-data-center-size/
[Supercomputer Performance and Power Consumption]
CDC 6600
http://en.wikipedia.org/wiki/CDC_6600
CDC 7600
http://en.wikipedia.org/wiki/CDC_7600
Cray 1
http://en.wikipedia.org/wiki/Cray-1
GF11
http://dl.acm.org/citation.cfm?id=327139
Cray 2
http://en.wikipedia.org/wiki/Cray-2
Numerical Wind Tunnel
http://en.wikipedia.org/wiki/Numerical_Wind_Tunnel_(Japan)
ASCI Red
http://en.wikipedia.org/wiki/ASCI_Red
ASCI White
http://en.wikipedia.org/wiki/ASCI_White
ASCI Q
http://top500.org/system/6359
Earth Simulator
http://www.top500.org/system/167148
BlueGene/L
http://www.top500.org/system/175171
JUGENE (BlueGene/P)
http://www.top500.org/system/176321
Cray XT5
http://www.top500.org/system/176208
Jaguar (XT5)
http://www.top500.org/system/176544
Tianhe-1A
http://www.top500.org/system/176929
K Computer
http://www.top500.org/system/177232
Titan (XK7)
http://www.top500.org/system/177975
Tianhe-2
http://www.top500.org/system/177999
[Hosting Companies]
http://www.netcraft.com/internet-data-mining/hosting-provider-server-count/
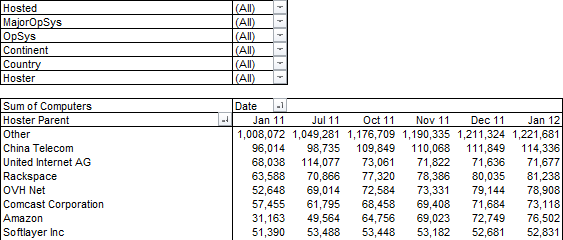
http://www.datacenterknowledge.com/archives/2009/05/14/whos-got-the-most-web-servers/
OVH: 150,000
SoftLayer: 100,000
1&1 Internet: > 70,000
LeaseWeb: 36,000 (2011)
Intergenia: 40,000
IBM sold server business to Lenovo.
https://www-03.ibm.com/press/us/en/pressrelease/43016.wss
CY13-Q4 OpenStack, OpenNebula,Eucalyptus,CloudStack社区活跃度比较
| 发表时间:2014-01-02 21:39:38 | 评论:2 |
本文是对《CY13-Q3 OpenStack, OpenNebula,Eucalyptus,CloudStack社区活跃度比较》一文的补充和更新。对本文内容感兴趣的读者,可以通过电子邮件或者新浪微博(@qyjohn_)与我联系。
本文同时发布了一个英文版本,可以参见CY13-Q4 Community Analysis — OpenStack vs OpenNebula vs Eucalyptus vs CloudStack这个帖子。
这个社区活跃度比较项目起源于CY11-Q4,此篇报告是到目前为止已经发布的第九个季度性的报告。尽管作者于2012年10月至2013年7 月间曾短暂地就职于Eucalyptus公司,但是本文中所表达之观点完全是作者本人的观点,而非作者目前或以前所在公司的观点。
本文的目的是通过论坛和邮件列表的原始数据对OpenStack、OpenNebula、Eucalyptus和CloudStack项目的社区活跃度进 行分析和比较。主要的原始数据是自2009年来这四个项目的官方论坛和邮件列表每个月所产生的讨论主题数、帖子数、以及参与讨论的总人数(邮件地址或者用 户账号)。为了获取这些数据,我写了一个Java程 序自动地从这四个项目的网站下载了所有的论坛和邮件列表信息,并且从这些信息中分析提取出我所需要的数据。程序提取的数据被导入MySQL数据库中以便进 行统计分析,统计分析的结果通过LibreOffice生成分析图表。
在过去几年种,有一些早期的论坛和邮件列表已经被停用,这些数据我们再也不能够访问到了。幸好我们有这个项目刚刚启动时所创建的MySQL数据库,还有过去每个季度所发布的季度性报告,使得我们可以对每个项目进行完整的分析。
对于具有多个会员系统的项目(例如一个论坛和一个邮件列表),我们采取了大量的措施来消除会员重复计数(同一个人被当成不同的会员计算了两次或者两次以上)的情况。
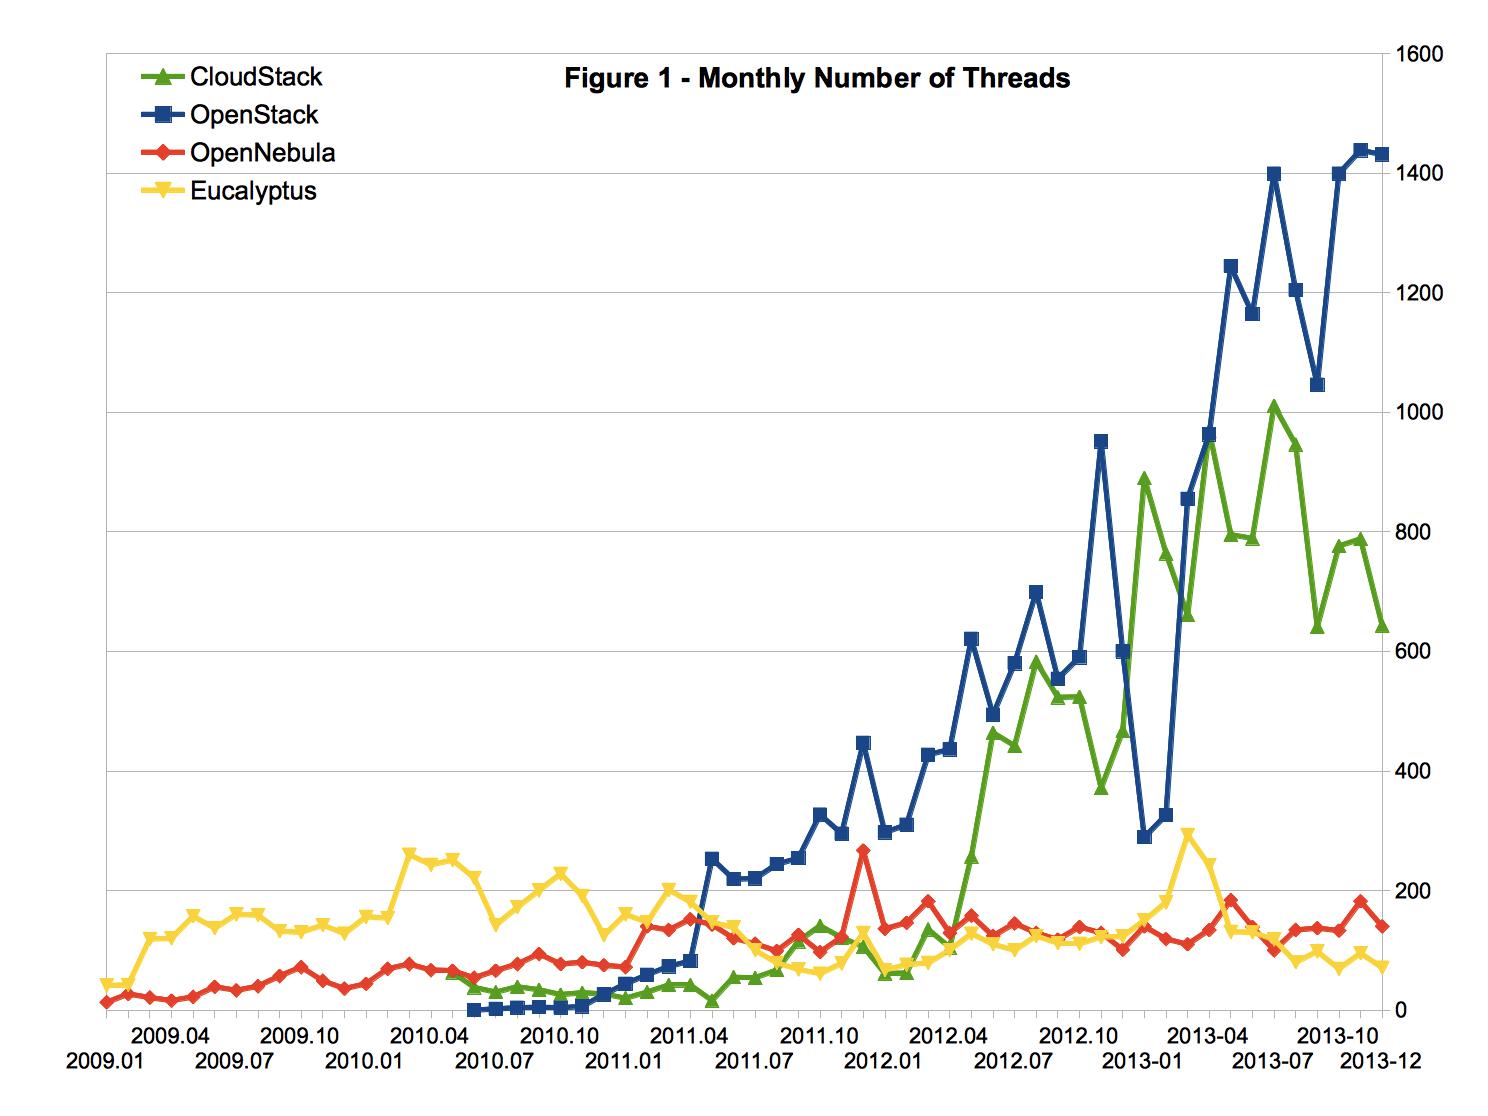
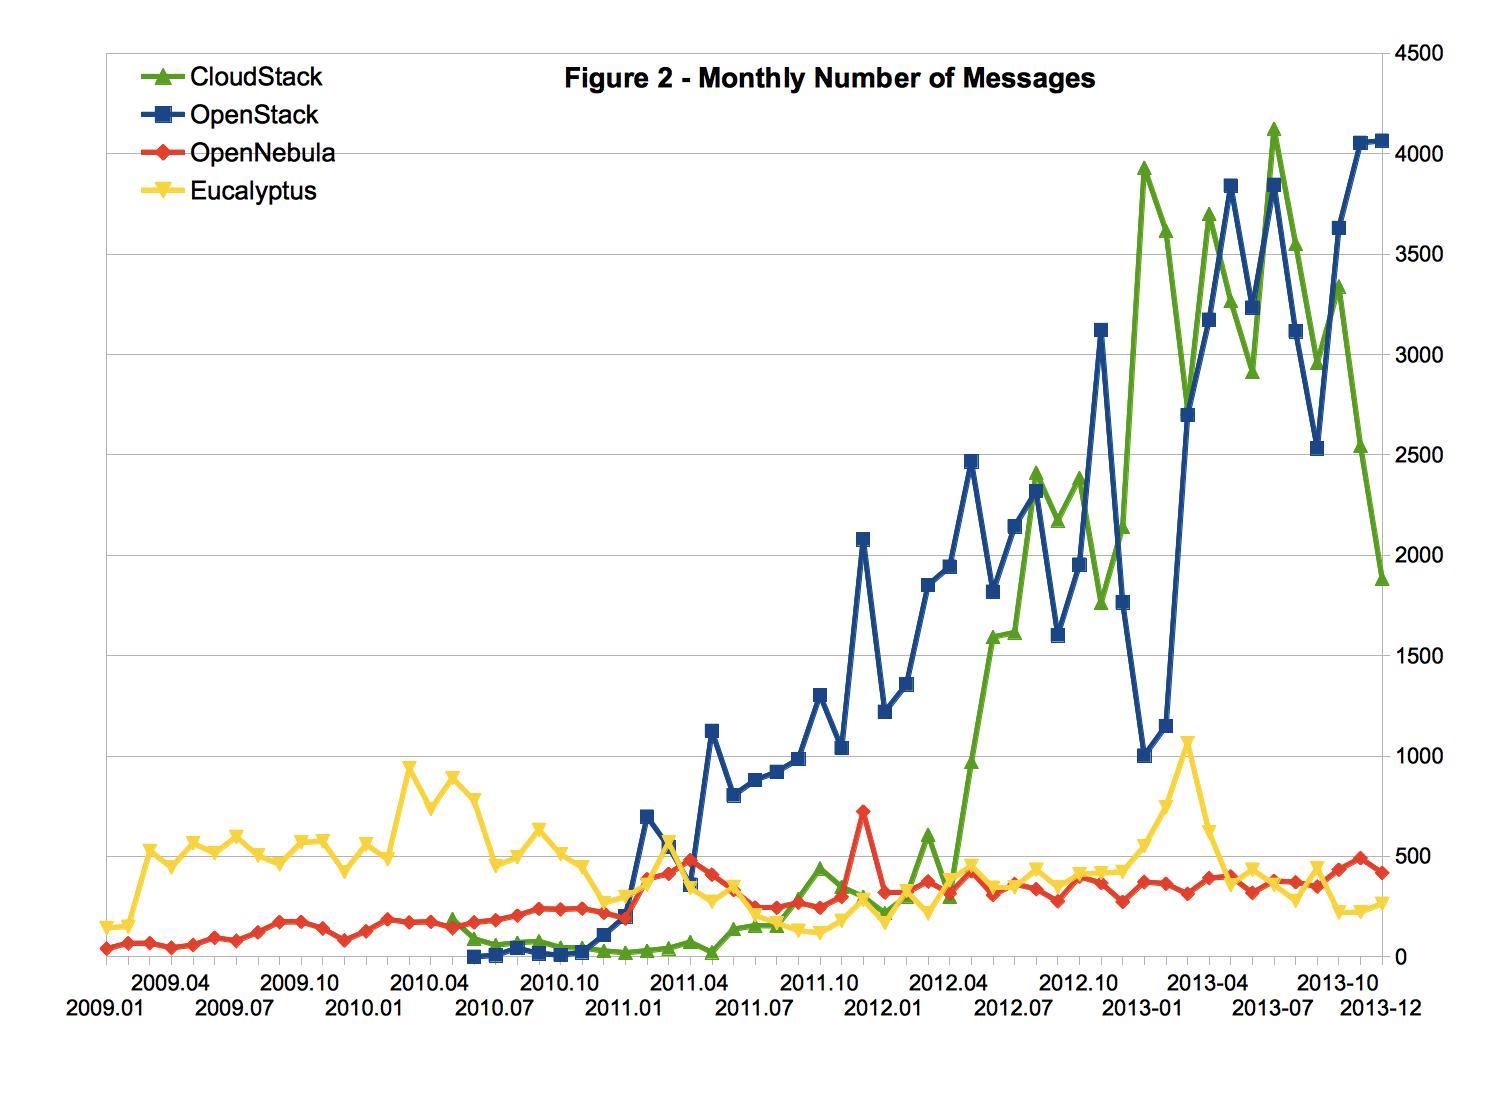
图1 和图2分别是如上所述四个项目每个月所产生的讨论主题数和帖子数。可以看出:
(1) 在过去12个月中,与OpenStack和CloudStack相关的讨论数量在同一水平上,与Eucalyptus和OpenNebula相关的讨论数量在同一水平上;
(2) 在过去12个月中,与OpenStack和CloudStack相关的讨论数量远大于与Eucalyptus和OpenNebula相关的讨论数量。
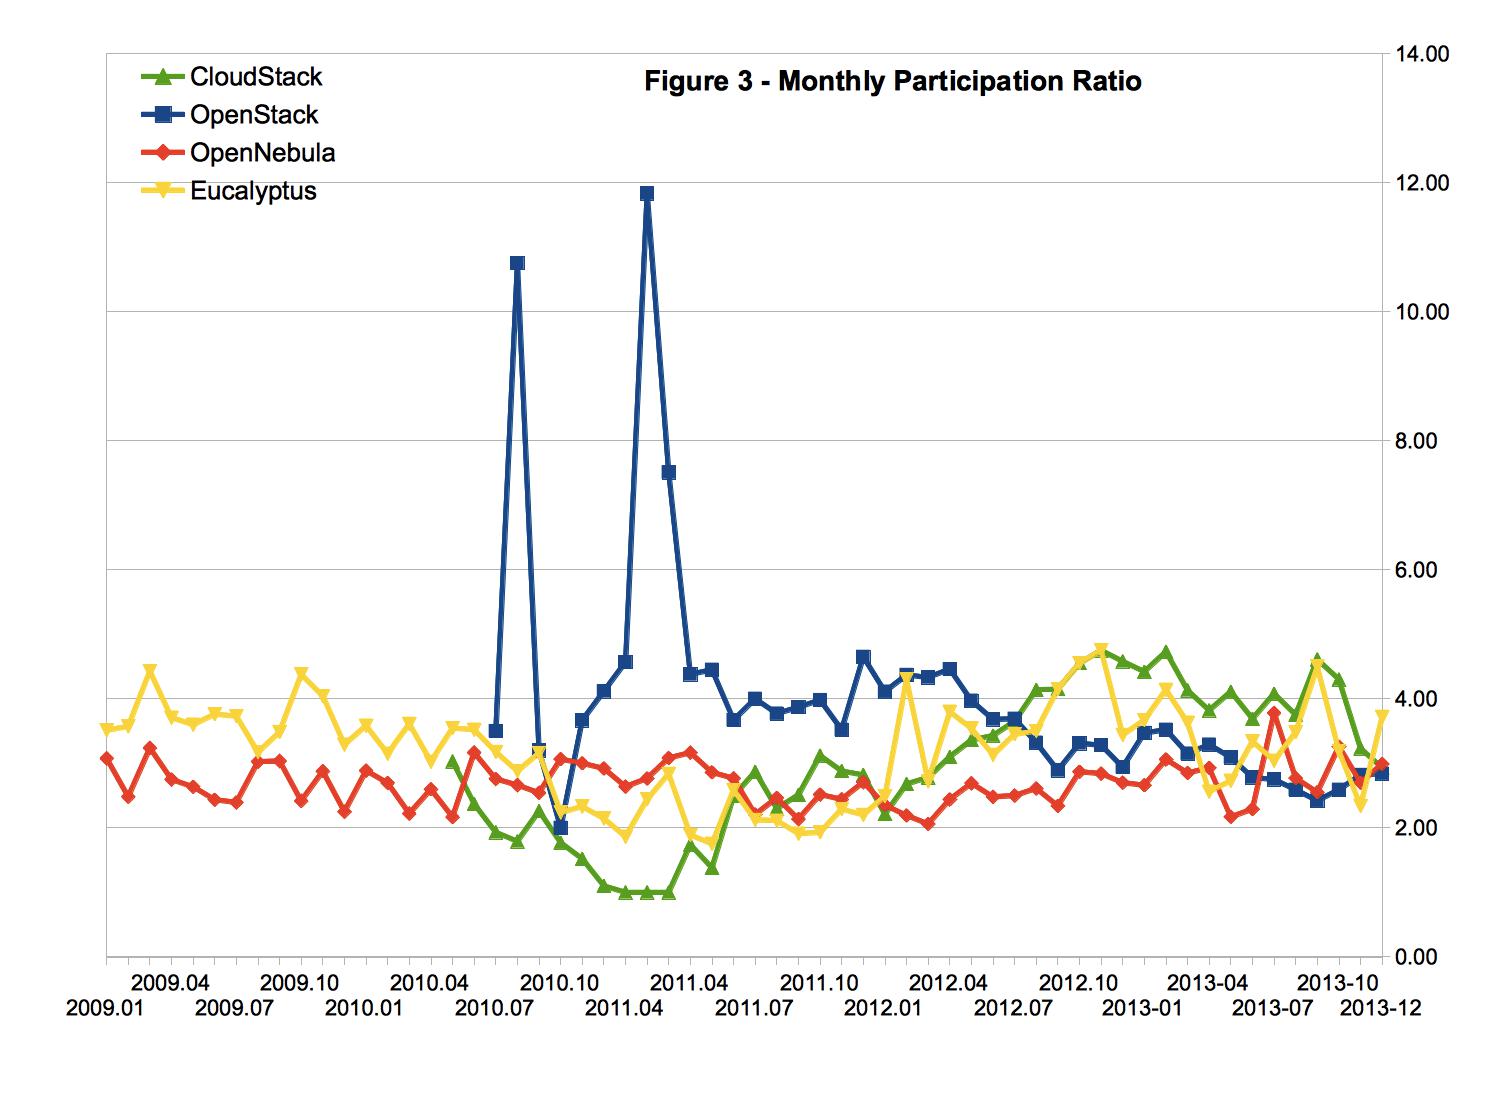
通常来讲,一个讨论主题得到的回复数越多,表明该主题的讨论越深入。一个论坛或者邮件列表如果只有主帖而没有回复,说明这个社区的参与程度很低。因此,平 均意义上的“讨论帖子数/讨论主题数”则反映了一个社区的参与程度,这里我们暂且称之为参与度(Participation Ratio)。
由图3 可以看出,在过去12个月中CloudStack和Eucalyptus项目的参与度相对较高高,接近于4;OpenStack与OpenNebula项目的参与度相对较低,接近于2。
我们也注意到参与度这个概念引起了一些争议。有些人认为“讨论帖子数/讨论主题数”较低象征着某个社区具有快速解决问题的能力,社区成员所提出的问题能够在很短时间内得到解答,因此不需要多个帖子来解决一个问题。有些人认为“讨论帖子数/讨论主题数”较高可能意味着某个社区可能出现了争论,而这种争论可能已经偏离了某个社区的讨论方向和范围。无论如何,参与度这个名称的确反映了我们的某些主观看法,在一定程度上削弱了本报告的客观性。由于我们暂时没有找到一个更加合适的替代名称,在这个报告里面还是延用原来的名称(欢迎各位读者贡献更好的参数名称)。
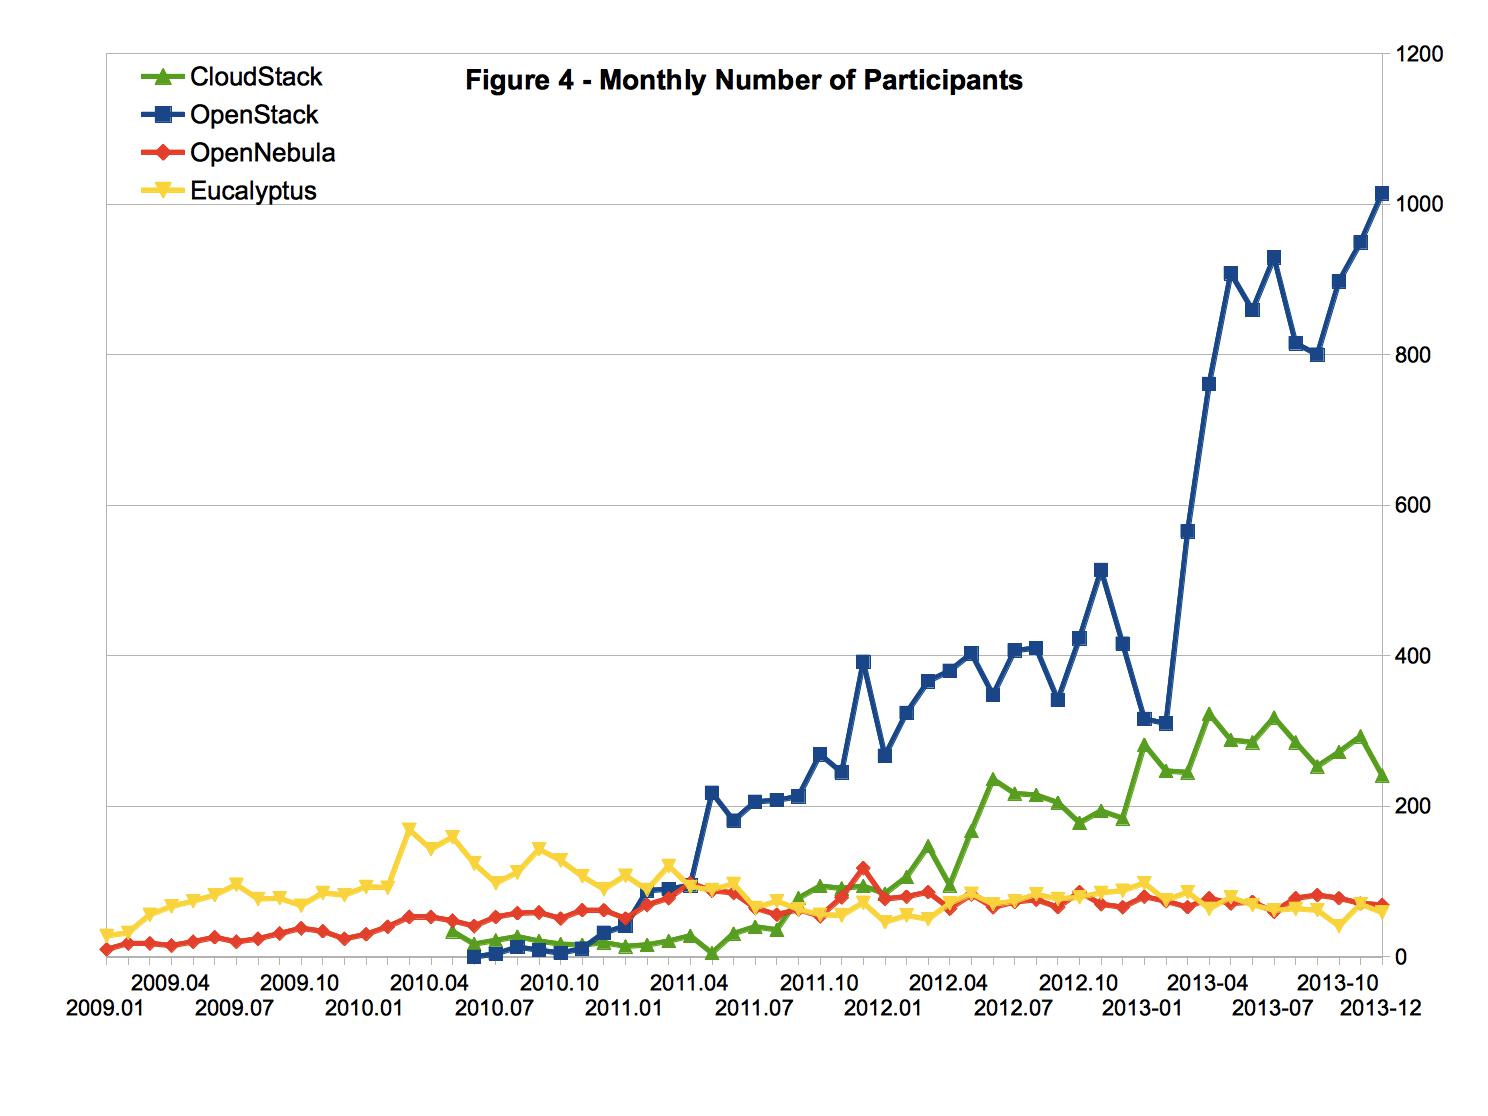
图4 所示为这四个项目每个月参与论坛或者邮件列表讨论的总人数。可以看出,OpenStack项目的活跃用户数量要远大于其他三个项目。CloudStack项目的活跃用户数量也明显大于OpenNebula和Eucalyptus。在过去12个月中,CloudStack和OpenStack项目的活跃用户数量都在稳步攀升(OpenStack项目有100%的增长,CloudStack项目有50%的增长),而Eucalyptus和OpenNebula项目的活跃用户数量基本上没有增长。
值得一提的是,虽然CloudStack的活跃用户数量稍微小于OpenStack,这两个项目的主题和帖子数量是基本相当的(参见图1和图2)。
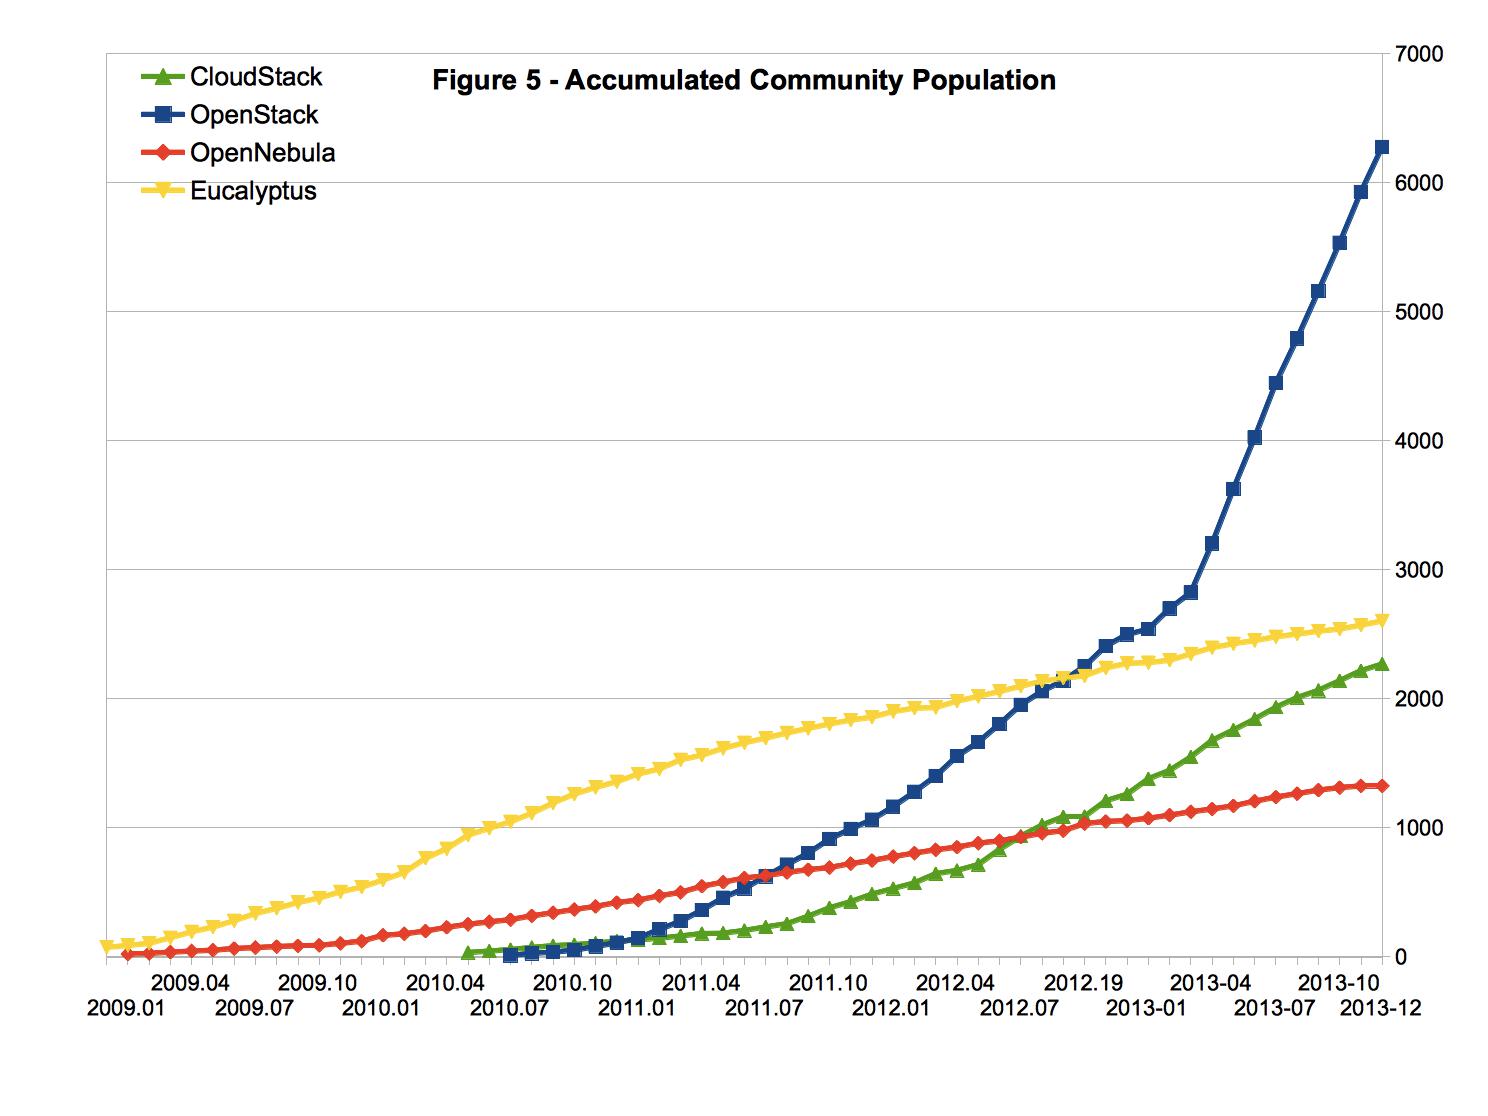
累计社区人口(简称社区人口)指的是曾经通过论坛或者邮件列表参与过讨论的用户和开发者总数。(不包括在论坛或者邮件列表中注册但是从未公开参与讨论的社 区成员。)这些人或多或少地使用过相关产品,但是并不代表他们目前还是活跃用户。图5 所示为这四个项目的社区人口增长趋势。可以看出,OpenStack与Eucalyptus项目的社区人口遥遥领先,CloudStack与OpenNebula项目的社区人口相对较低。
问题在于,开源IaaS软件经过这么多年的发展,长期累计社区人口的意义已经越来越弱。一方面,某些早期用户可能已经多次改变了阵营;另一方面,某些早期论坛和邮件列表已经结束了历史使命。从社区活跃度的角度来看,我们认为最近6 个月或者最近12个月的累计社区人口可能是有意义的,但是将累计社区人口无限制地延伸到侏罗纪时代,可能会使这个参数失去实用价值。
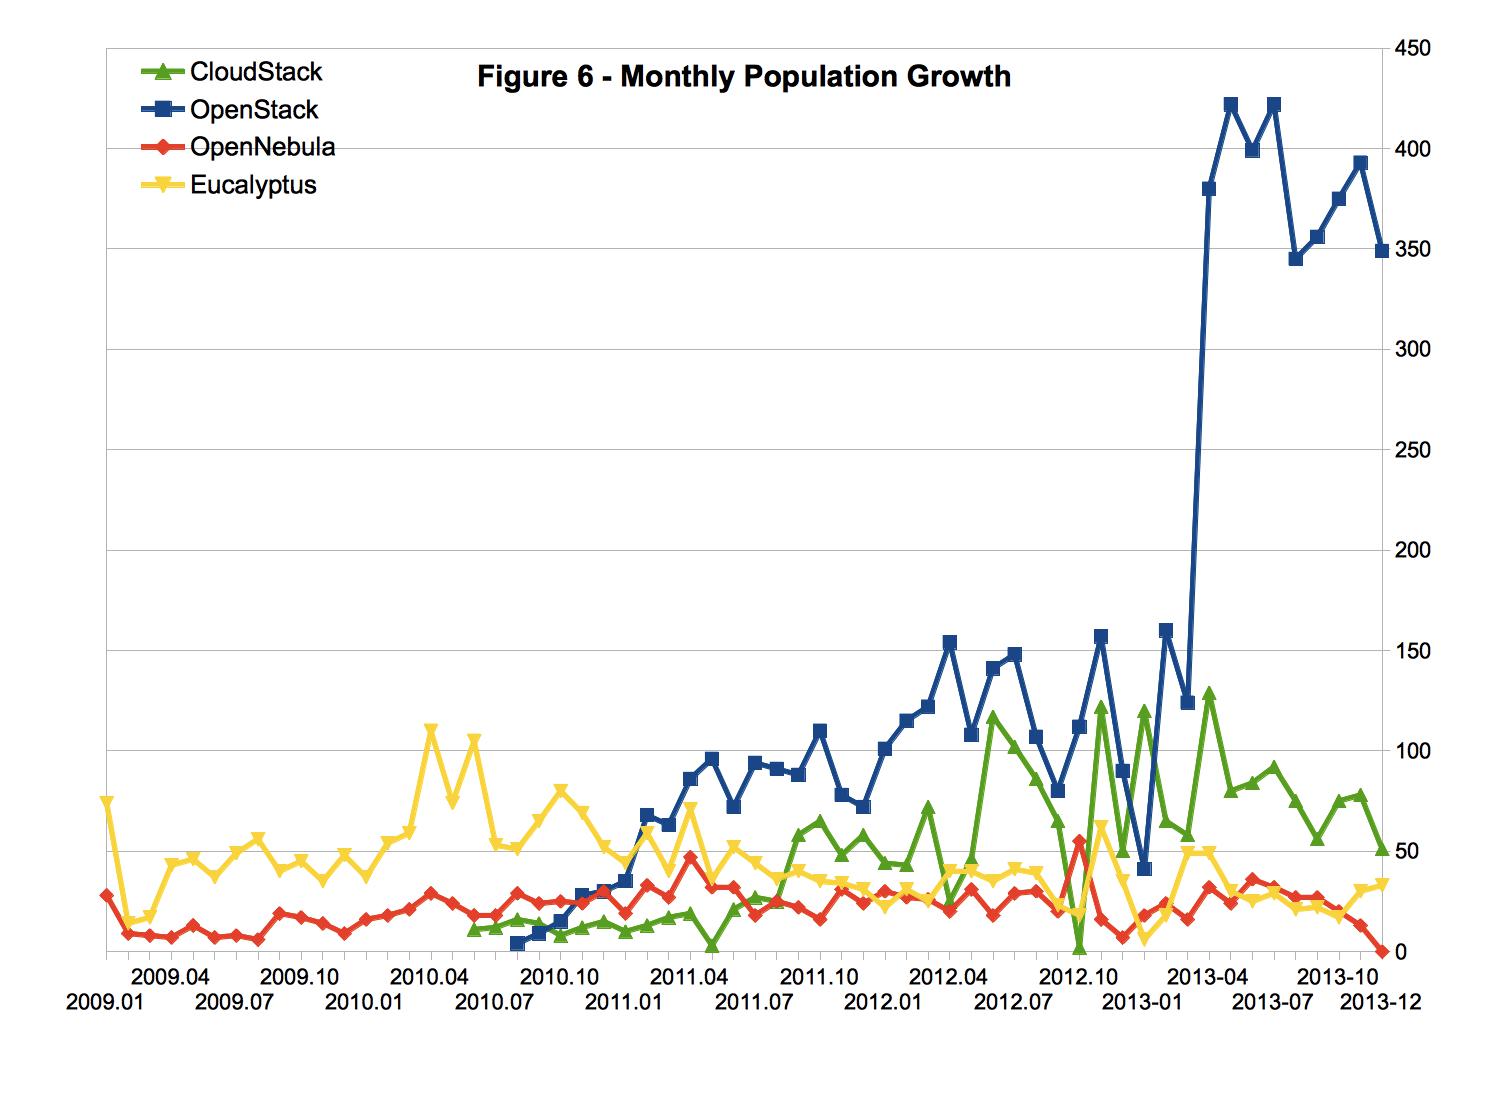
图6 所示为这四个项目每个月新增加的社区人口数量。在过去六个月中,CloudStack与OpenStack的社区人口增长速度基本相当。
与CloudStack和OpenStack向比较,Eucalyptus和OpenNebula的社区人口增长较为缓慢。
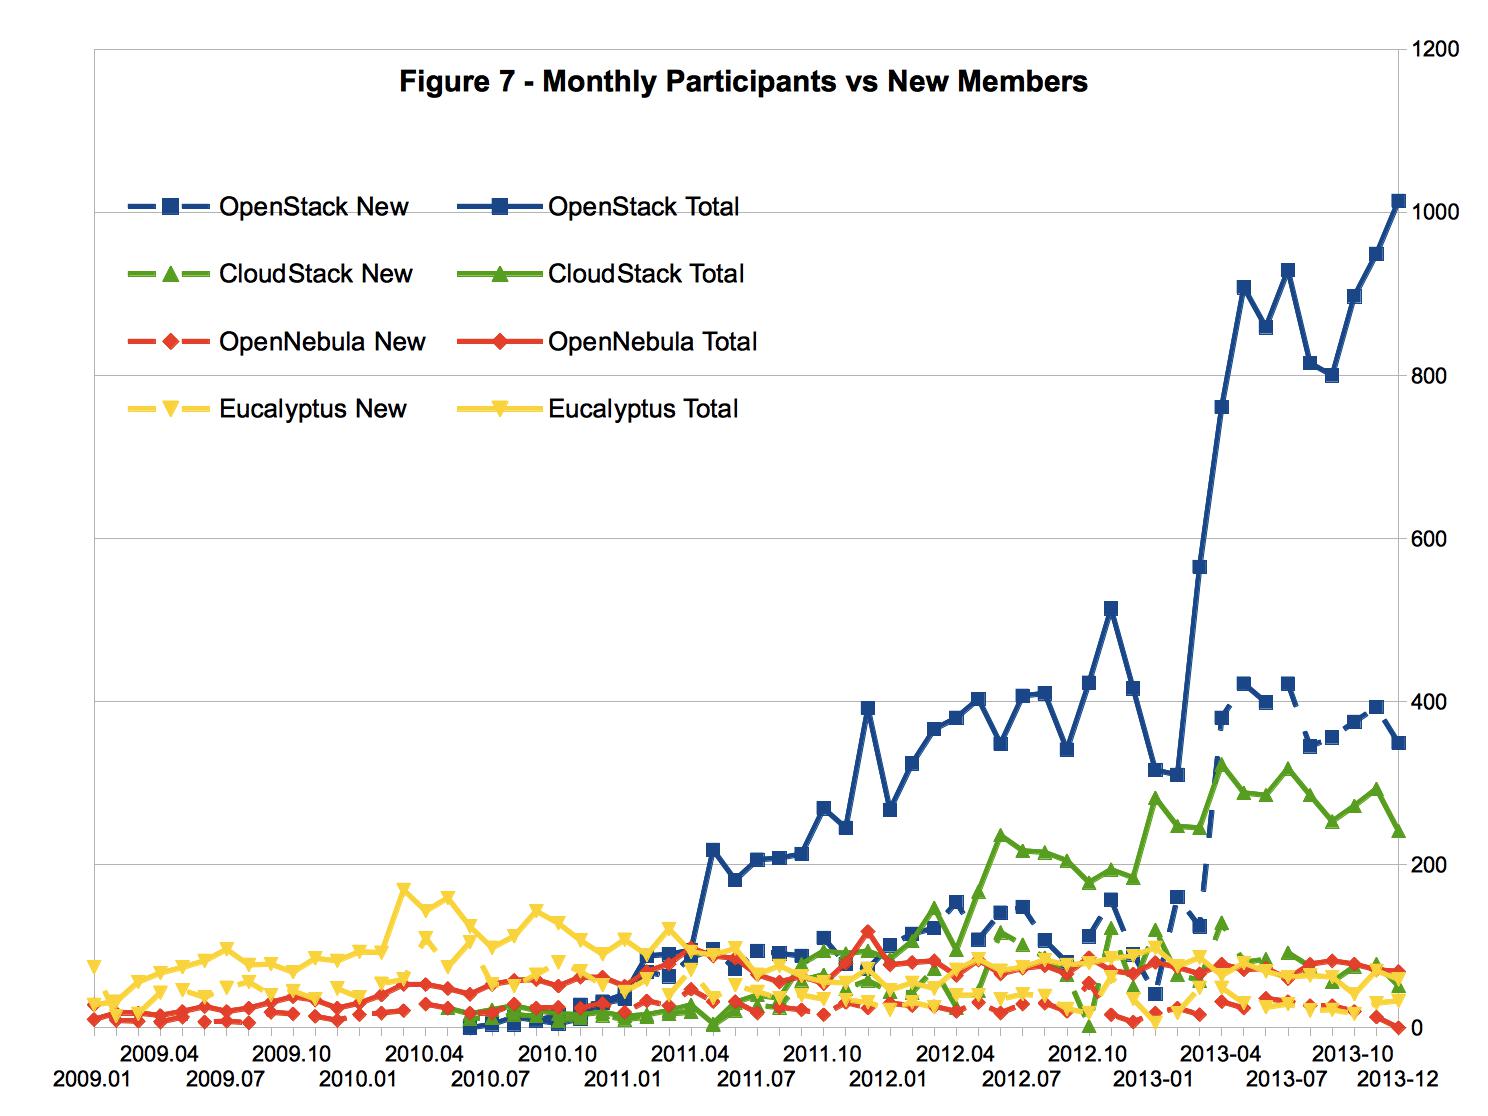
图7 是图4 与图6的重新组合。其中,实线部分表示的是每个月参与论坛或者邮件列表讨论的人数,虚线部分表示的是每个月新加入论坛或者邮件列表的人数。
在过去12个月中,OpenStack与CloudStack项目的新增人口占当月活跃用户的30%左右,OpenNebula与Eucalyptus项目大概是50%。如 果不考虑社区人口的规模的话,可以认为OpenStack与CloudStack社区的粘性大于OpenNebula与Eucalyptus社区。
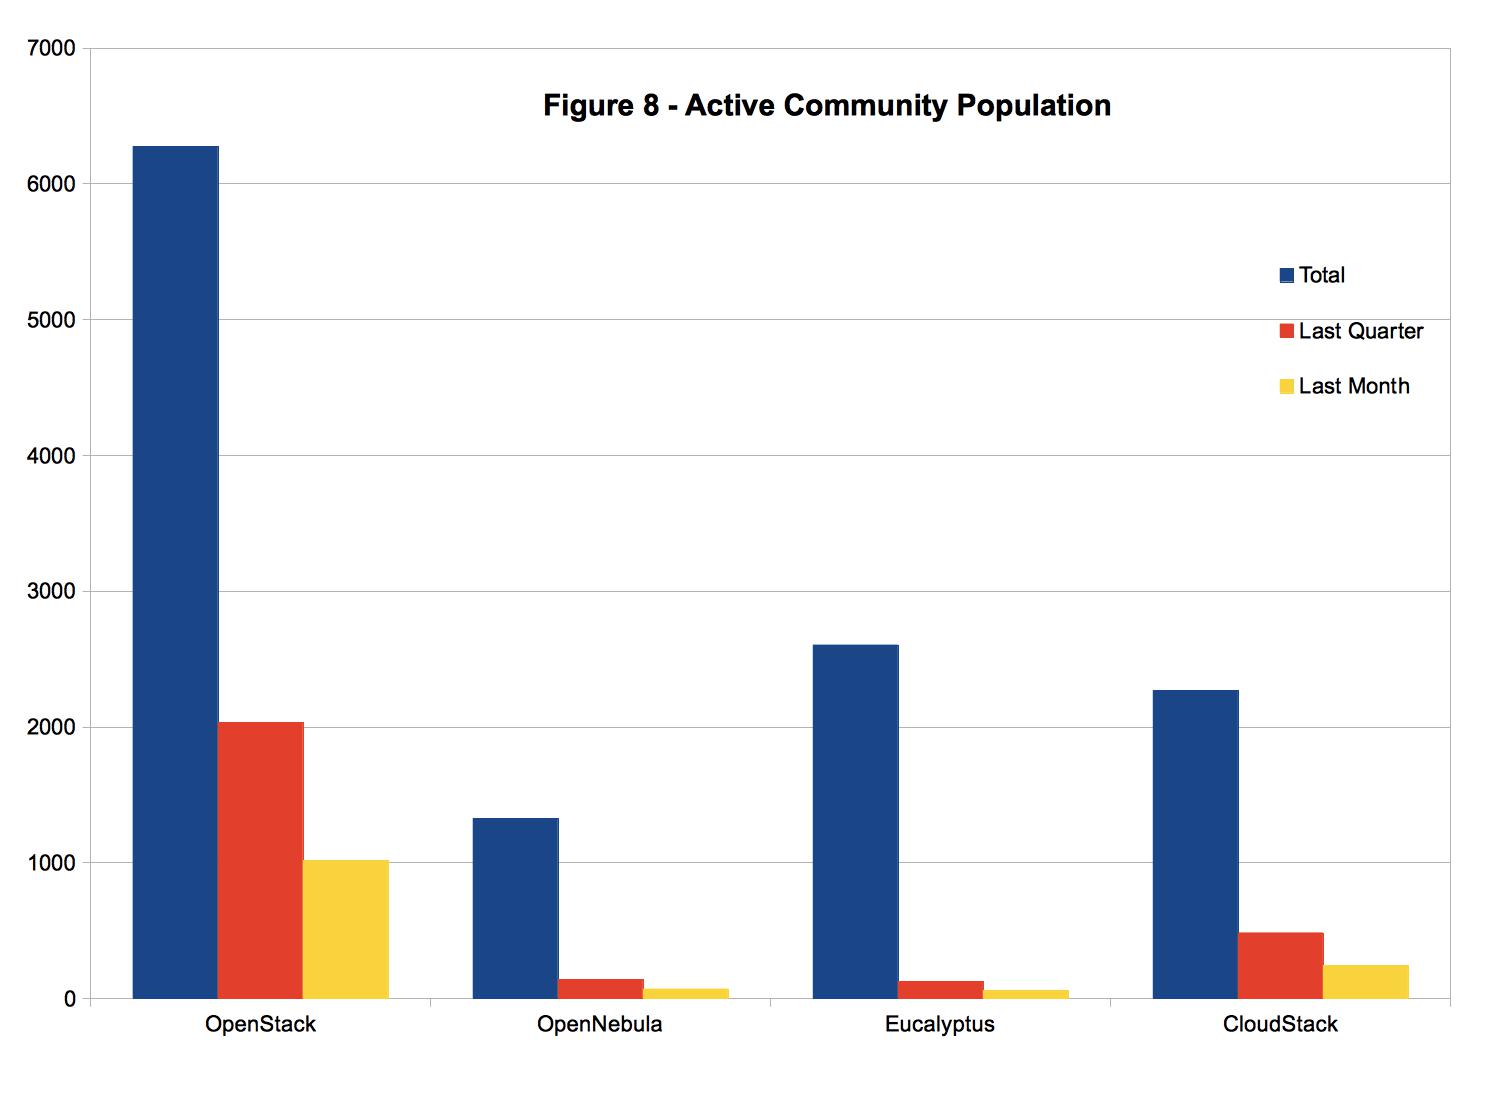
图8 所示分别是本文所述四个项目的社区人口,过去一个季度的活跃用户数量,以及过去一个月的活跃用户数量。可以看出:
(1) OpenStack的社区人口最多,然后是Eucalyptus、CloudStack、OpenNebula;
(2) 在过去一个季度中,OpenStack的活跃人口最多,然后是CloudStack、Eucalyptus、OpenNebula;
(3) 在过去一个月份中,OpenStack的活跃人口最多,然后是CloudStack、Eucalyptus、OpenNebula。
我们还计算了本季度活跃人口与累计社区人口的比值。对OpenStack项目来说,这个比值是32.4%;对于CloudStack项目来说,这个比值是21.3%;对于OpenNebula项目来说,这个比值是10.5%;对于Eucalyptus项目来说,这个比值是4.8%。很显然,相当部分的OpenStack和CloudStack社区成员选择了留下,而大部分的Eucalyptus社区成员选择了离开。这与我们在图7 中所观察到的现象(OpenStack与CloudStack社区的粘性大于OpenNebula与Eucalyptus社区)是一致的。
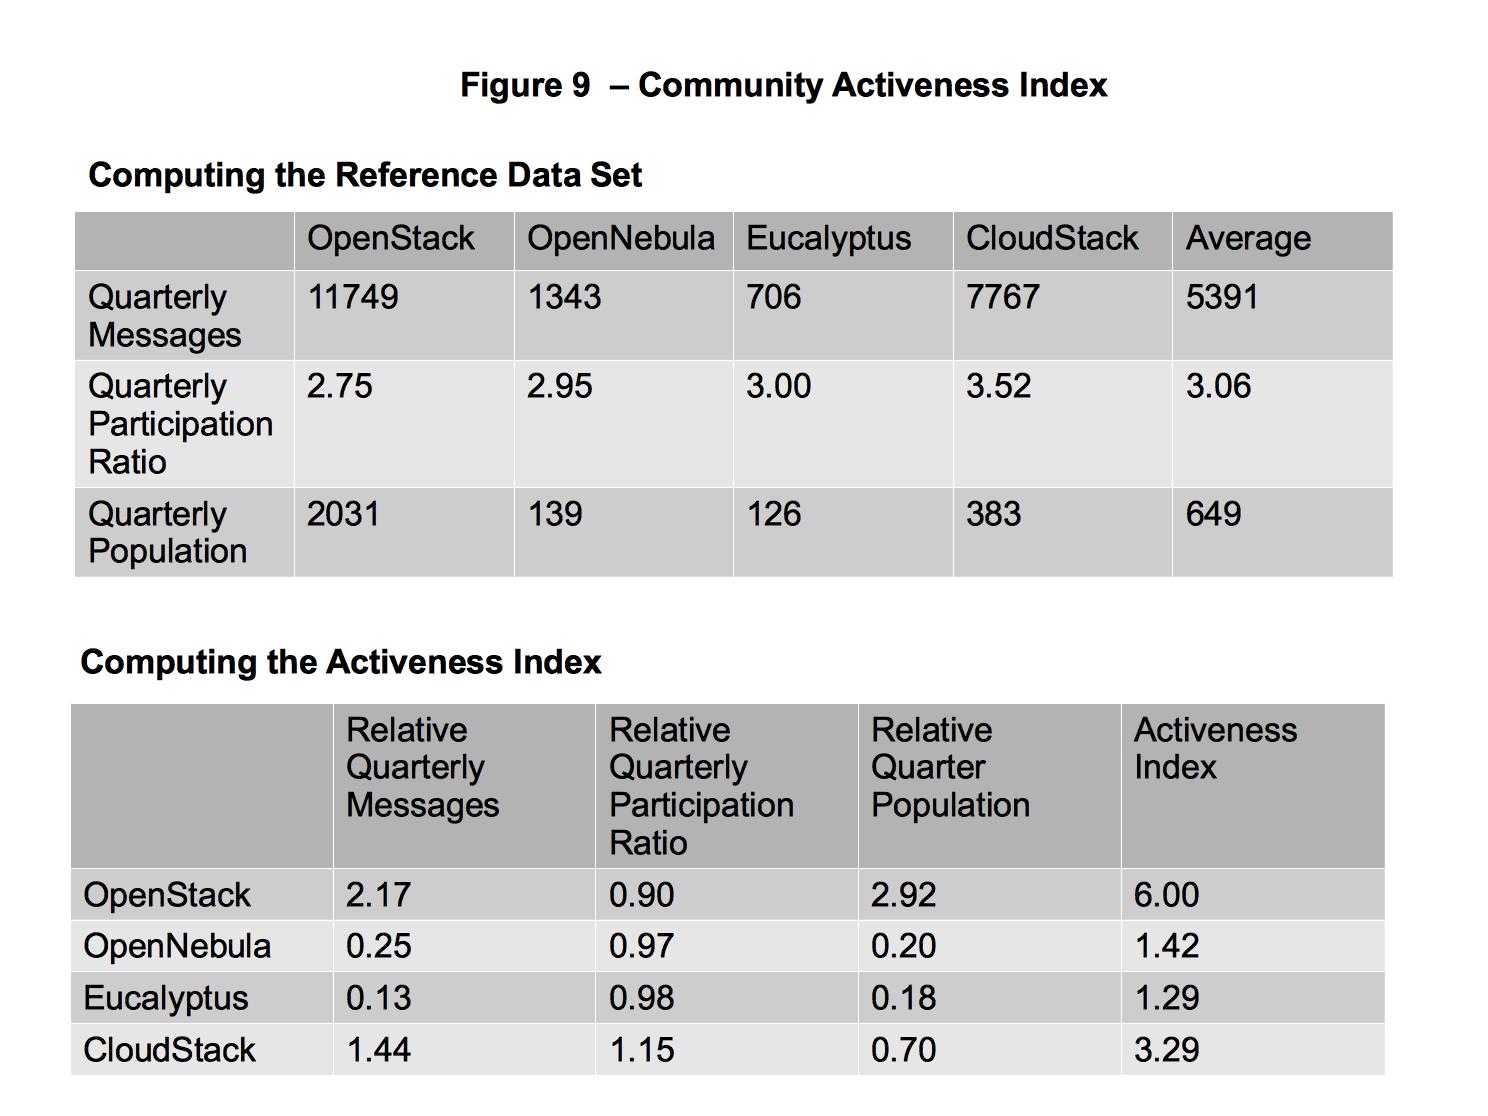
在CY12-Q3分析中,我们首次提出了“社区活跃度指数”这样一个参数。从CY13-Q3开始,这个参数修改为如下几个参数的组合:
(1) 本季度帖子总数,代表相关讨论的规模;
(2) 本季度参与度,代表每个问题获得的回帖数量;
(3) 本季度活跃用户,代表从社区获得帮助的可能性(长期)。
在这个分析中,我们选择如上各个社区的平均值作为参考数据,并将每个社区的数据与参考数据进行比较。我们将每个社区各个参数与平均值的比值之和称为“社区活跃度指数”。可以认为,社区活跃度指数最高的项目,是最活跃的项目。
从图9 中可以看出,目前OpenStack项目的“社区活跃度指数”最高(以明显的优势领先),然后是CloudStack、OpenNebula、Eucalyptus。
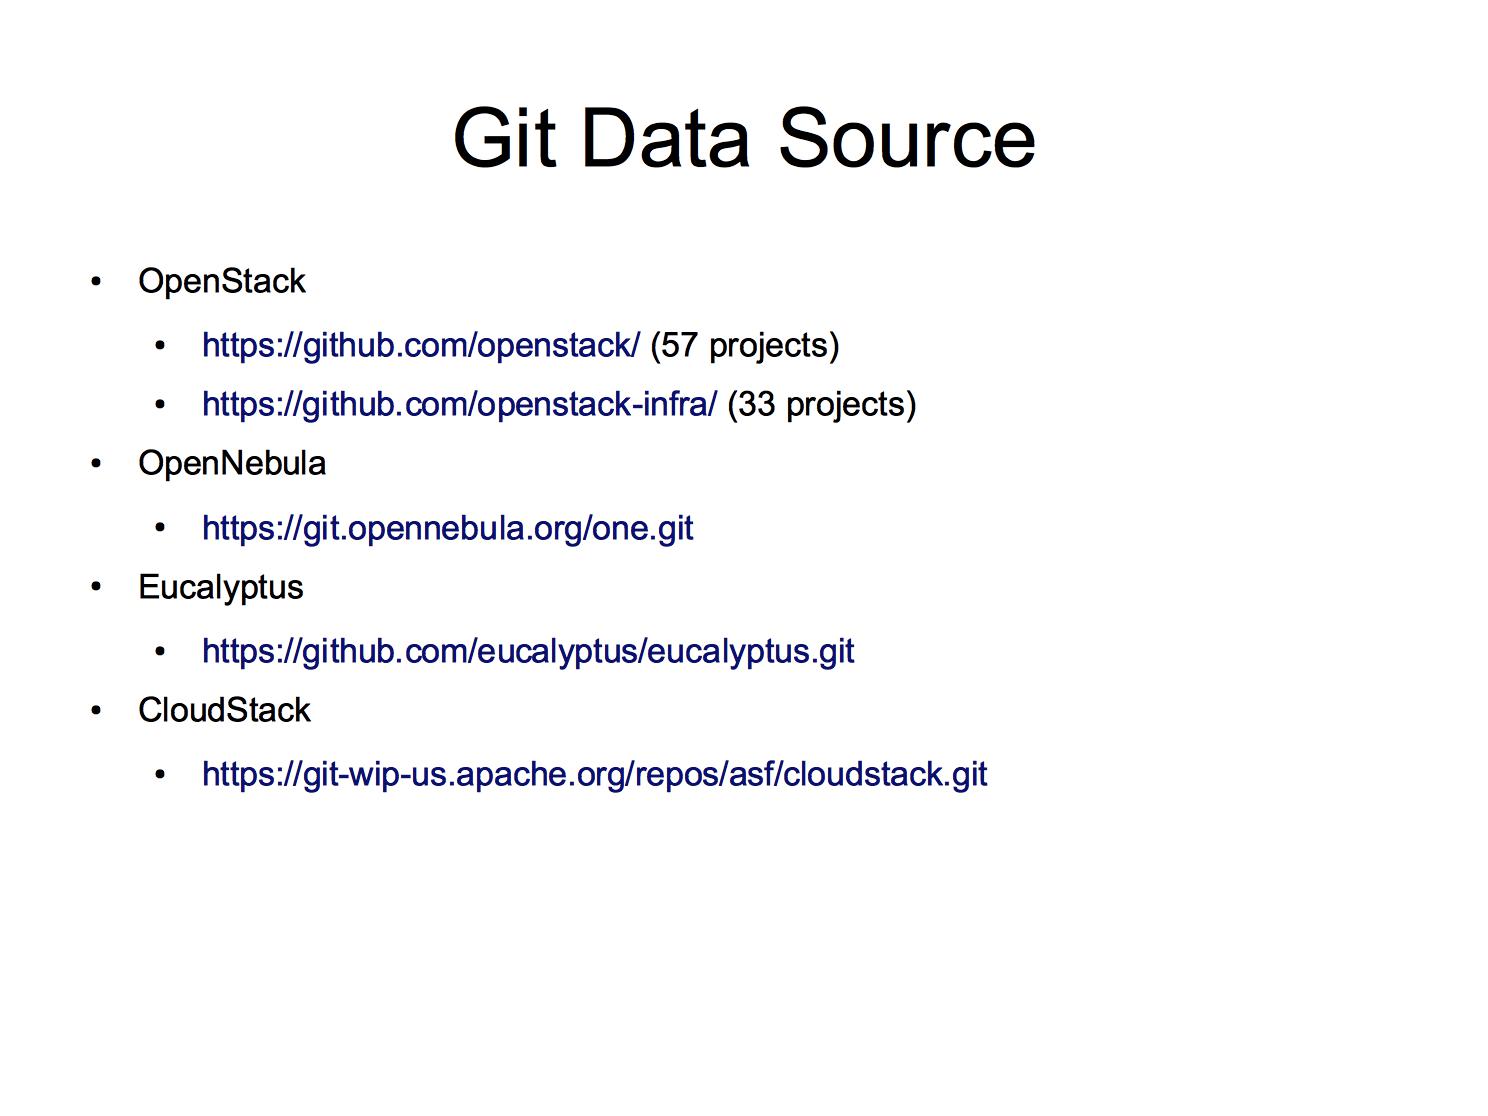
曾经有多位读者建议我们基于Git活动对各个主流的开源IaaS项目的开发情况进行分析。我们注意到CloudStack、Eucalyptus、OpenNebula以及OpenStack项目都使用git进行版本管理。因此,我们基于来自git的日志数据对这几个项目的开发情况进行了一些简单的分析。需要指出的是,对于OpenStack项目来说,其数据源包括了托管在github.com上的openstack项目(包含57个子项目)和openstack-infra项目(包含33个子项目)。
在CY13-Q1报告中,我们使用了git log这个命令获取日志数据。从CY13-Q2起,我们将使用git log –no-merges这个命令获取日志数据。
值得一提的是,git是一个分布式的版本管理系统。使用git进行版本管理,开发人员通常都是在本地代码库上工作。当开发人员执行一次commit操作时,对应的代码改动只被记录在本地代码库中。除非时开发人员执行了push操作,这些代码改动不会被反映到主代码库中。很多开发人员倾向于在积累了一定数量的commit之后才进行push操作。因此,一些最近发生的commit操作不会被反映到我们的统计中来。根据我们的经验,上一个月的commit操作数量大概被低估了50%,而前一个月的commit操作数量大概被低估了20%。
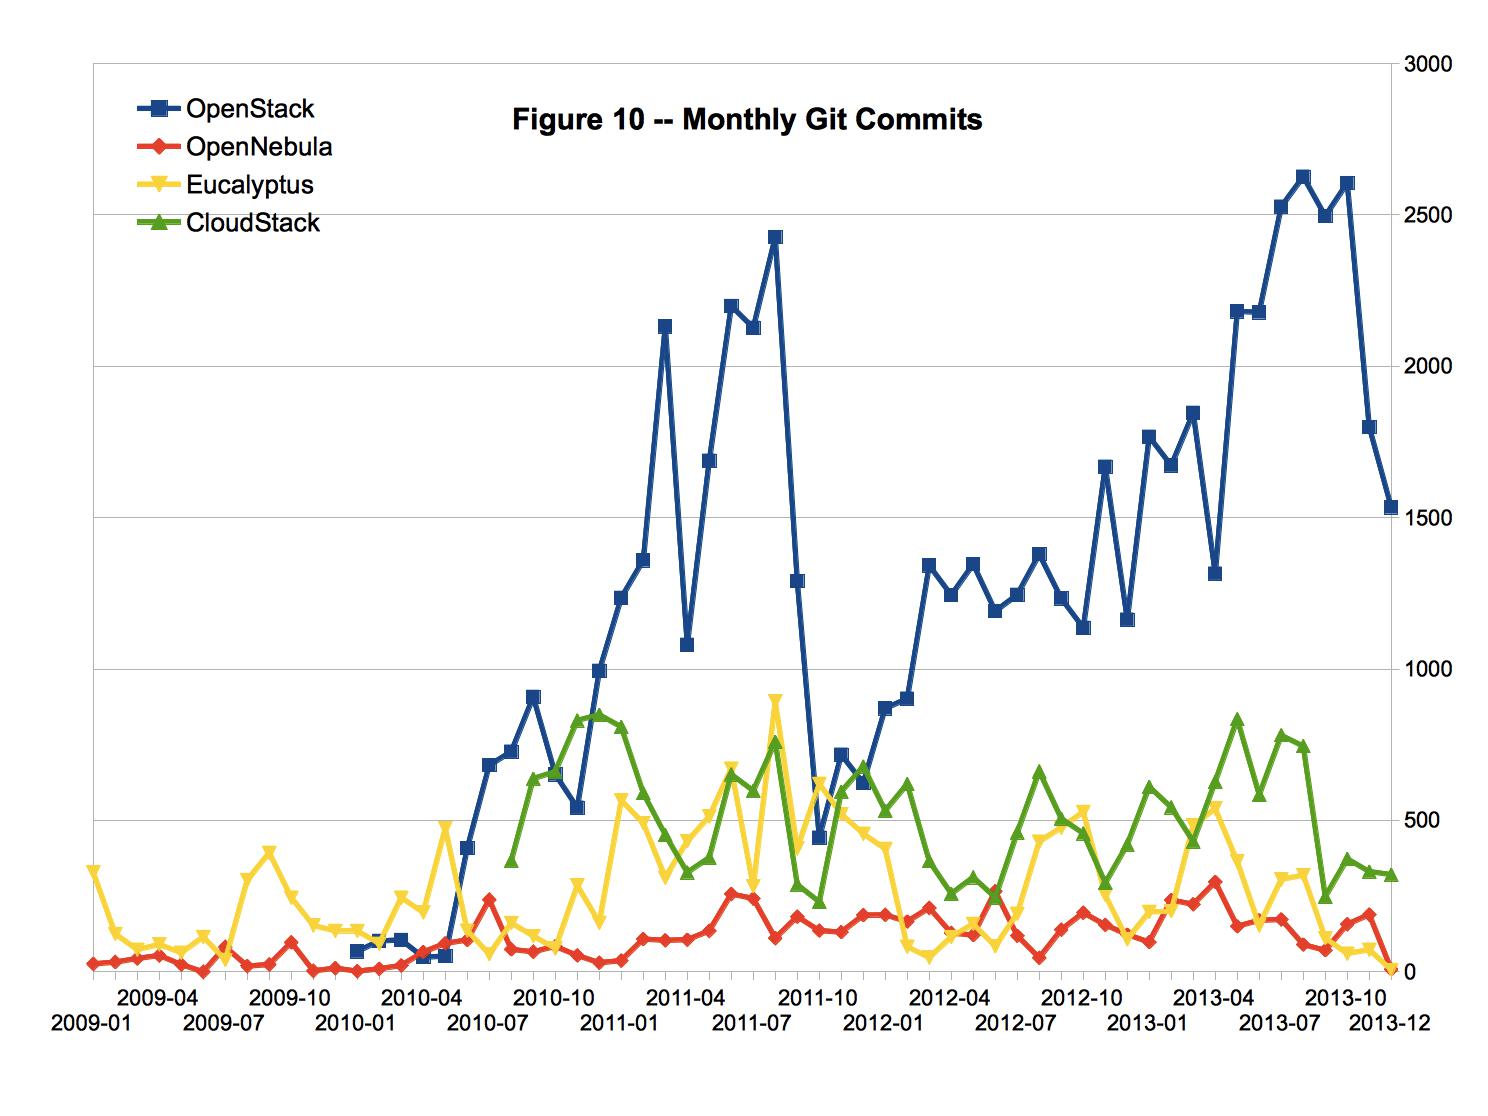
图10所示分别是本文所述四个项目每个月进行提交(commit)操作的次数。总体来看,OpenStack项目提交代码的频率远远超过其他三个项目。这是由于OpenStack项目的数据源一共包含了90个子项目。CloudStack项目提交代码的频率也明显高于Eucalyptus和OpenNebula。与OpenNebula项目相比较,Eucalyptus项目提交代码的频率也不低,但是存在较大的波动情况,具有比较明显的批量更新的特征。OpenNebula项目提交代码的频率较低,平均每个月提交代码200次左右。
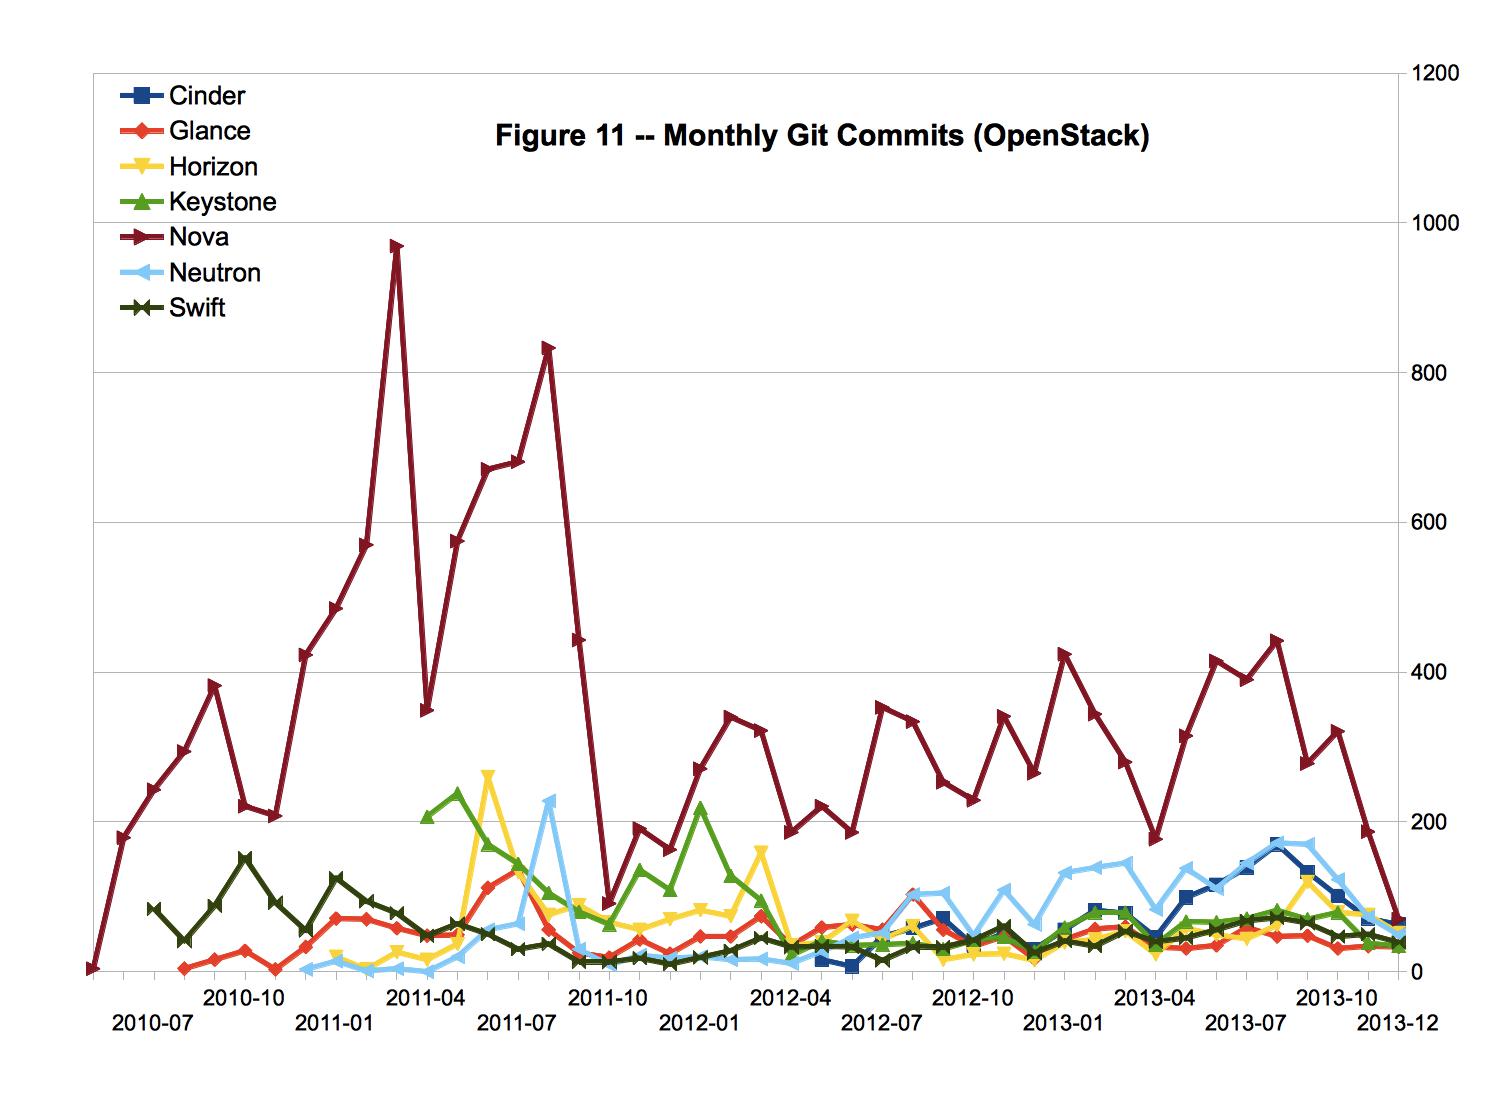
图11所示分别是OpenStack项目中各个子项目目每个月提交代码的次数。总体来看,Nova子项目提交代码的频率较高,是其他几个子项目的三倍左右。值得注意的是,尽管各个子项目提交代码的频率各不相同,但是其时程曲线基本上是一致的,波峰和波谷基本上出现在相同的时间。这个现象表明尽管OpenStack项目中各个子项目相对独立,但是具有相同或者相似的开发计划和开发进度。可以认为,OpenStack项目在子项目的管理和协调方面是做得比较好的。
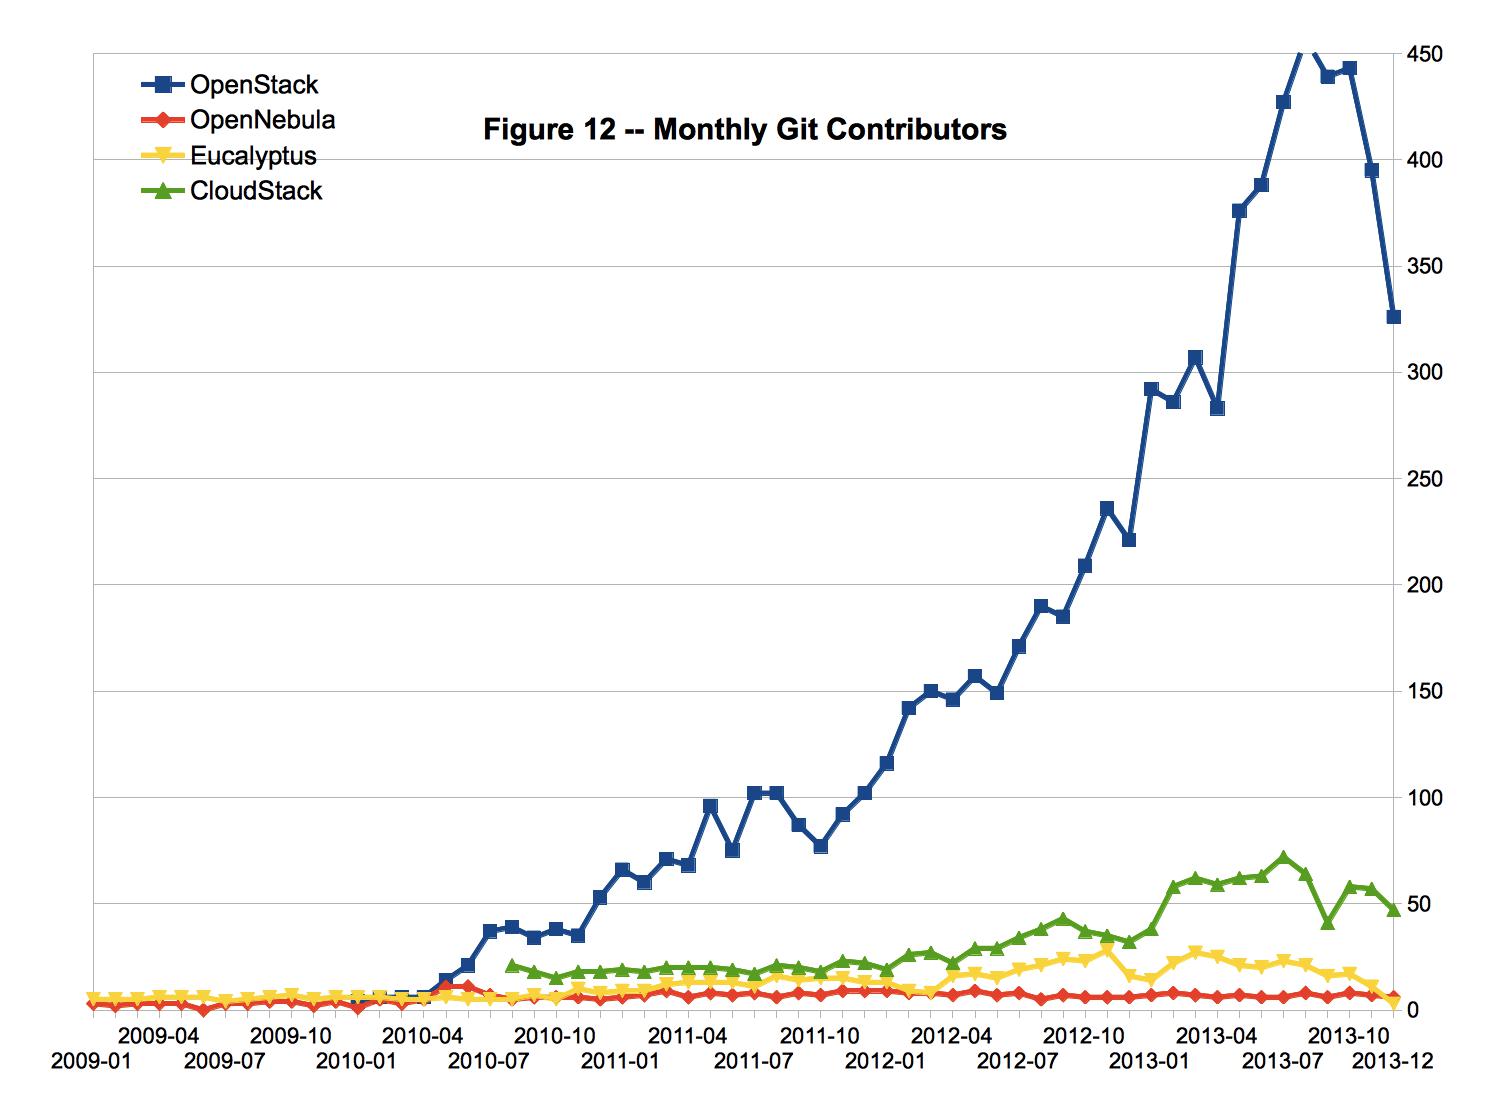
图12所示分别是本文所述四个项目每个月提交代码的人数。总体来看,OpenStack项目提交代码的人数远远超过其他三个项目,并且一直保持迅猛增长的势头。CloudStack项目提交代码的人数也有所增长,但是其增长速度较为缓慢。Eucalyptus项目和OpenNebula项目提交代码的人数相对较少,并且在过去12个月当中基本上没有增长。
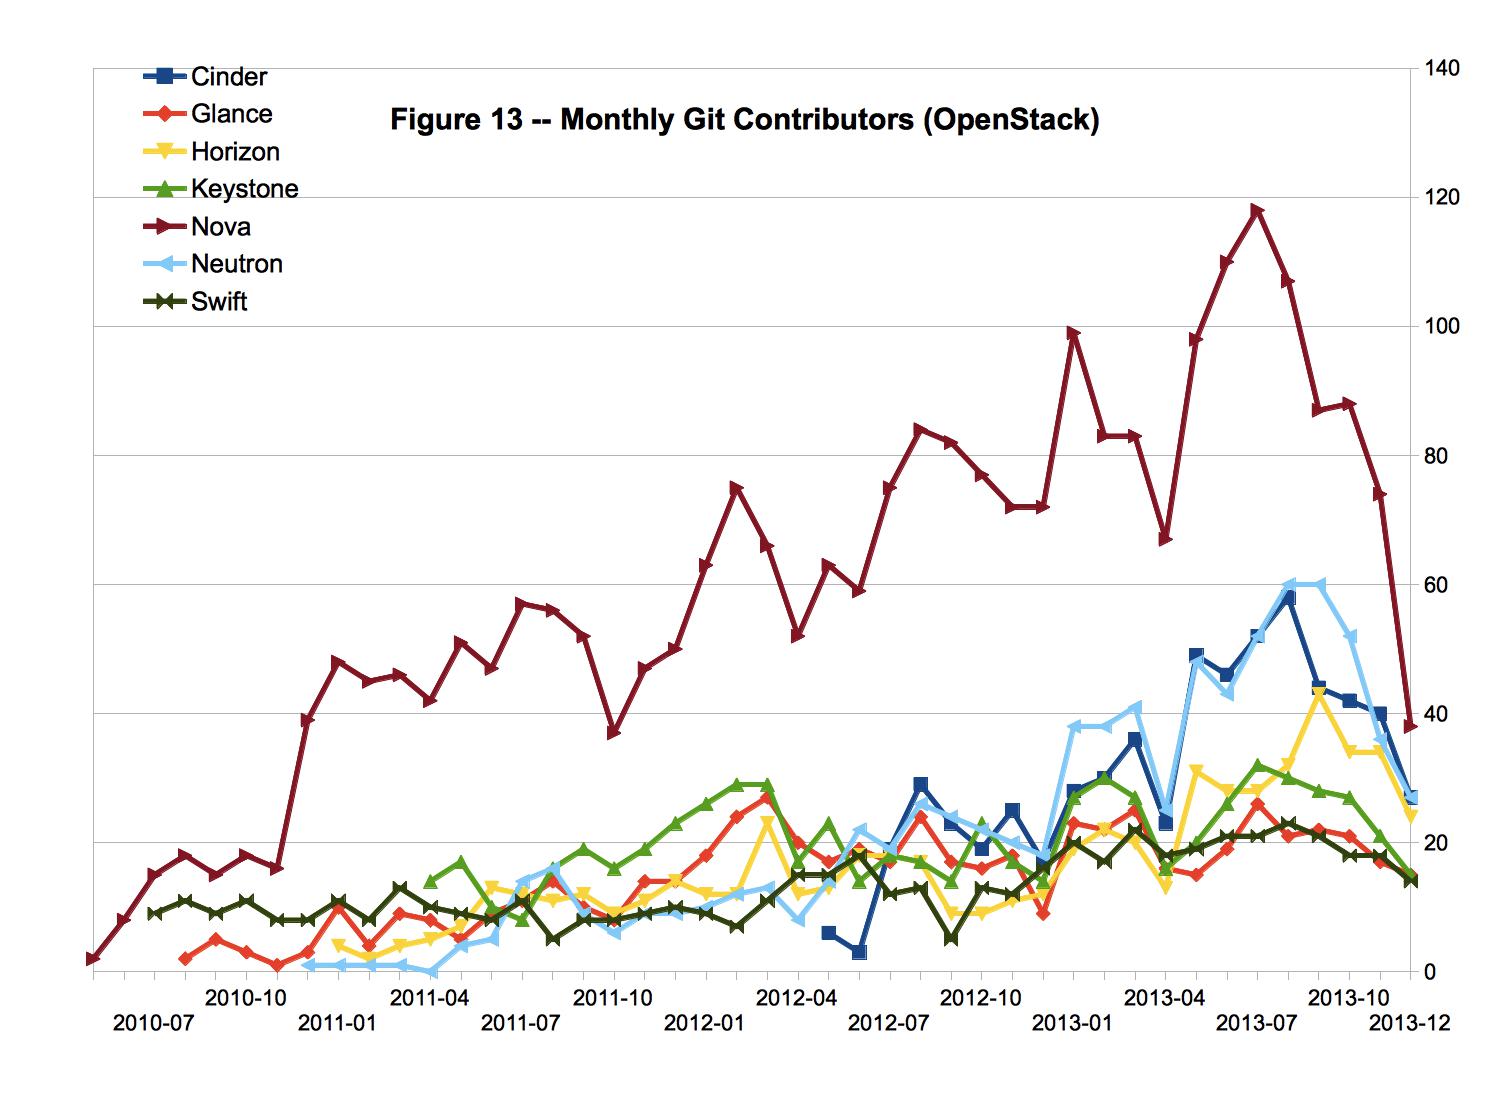
图13所示分别是OpenStack项目中各个子项目每个月提交代码的人数。总体来看,Nova子项目提交代码的人数较多,是其他几个子项目的三倍左右。
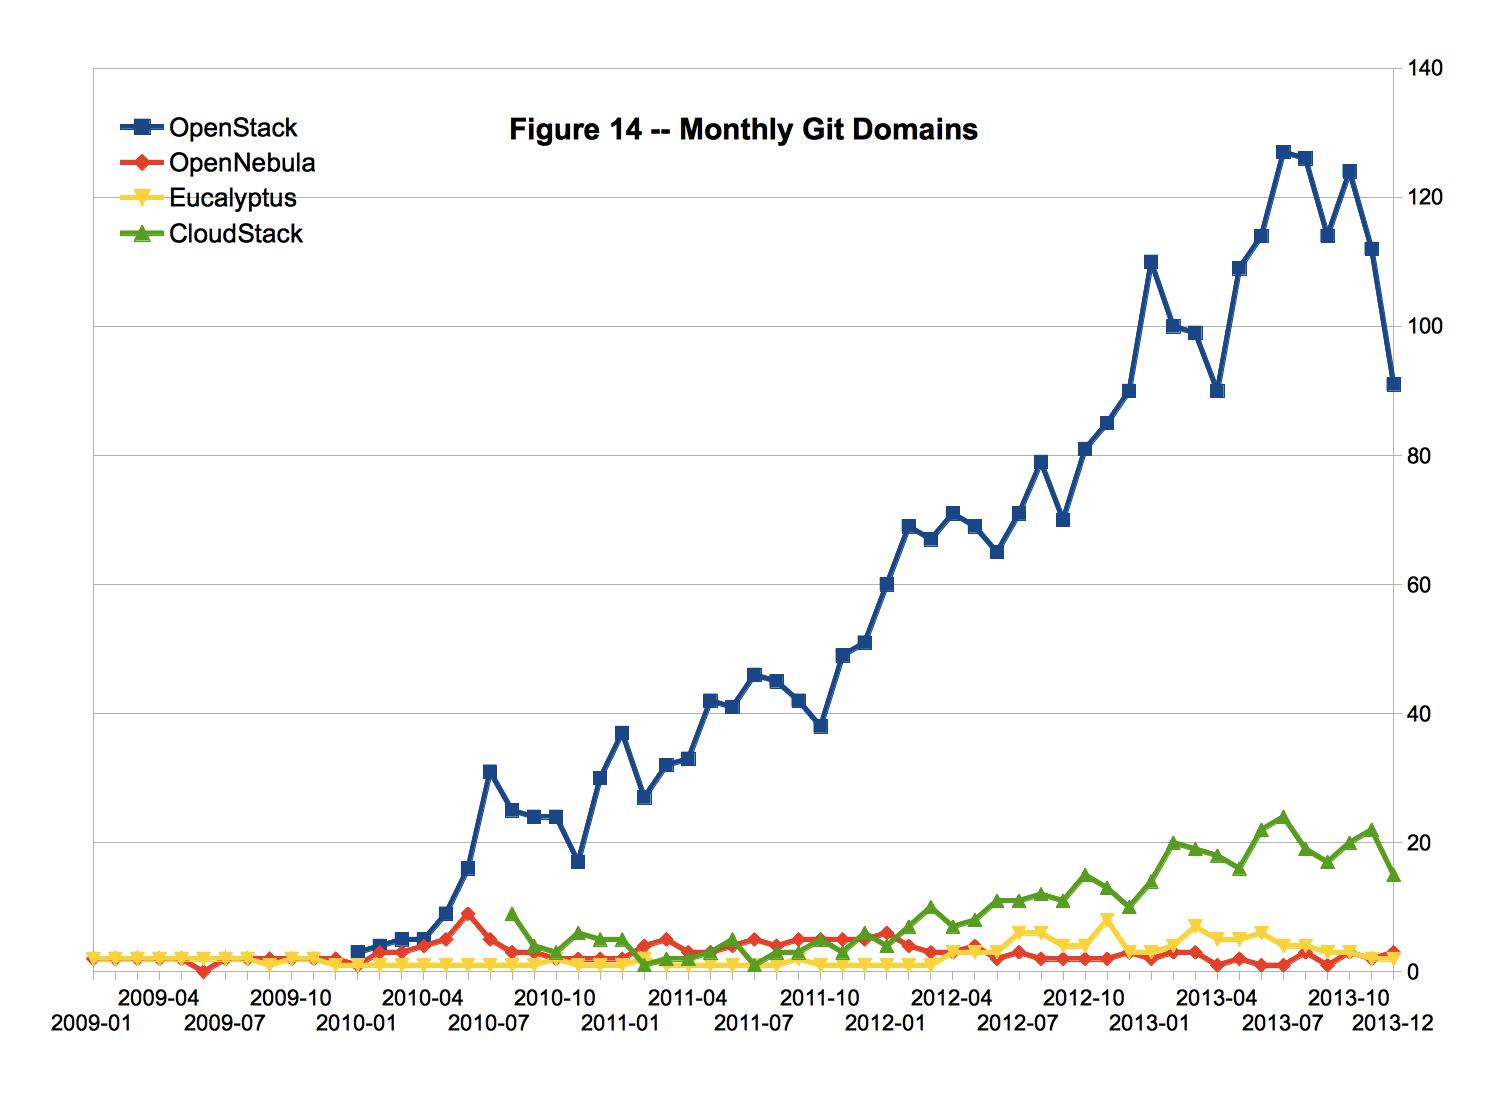
人们通常通过代码贡献者所使用的电子邮件地址来识别其所在的机构。尽管这种方式存在较大的缺陷(例如有一些机构鼓励雇员以个人的名义向开源项目贡献代码),但是还是可以从某种程度上揭示不同机构对某个开源项目的贡献力度。图14所示分别是每个月向本文所述四个项目提交代码(commit操作)的邮件地址所属域名数量。总体来看,OpenStack项目提交代码的域名数量远远超过其他三个项目,并且一直保持迅猛增长的势头。CloudStack项目提交代码的域名数量也有所增长,但是其增长速度较为缓慢。Eucalyptus项目和OpenNebula项目提交代码的域名数量相对较少,并且在过去12个月当中基本上没有增长。
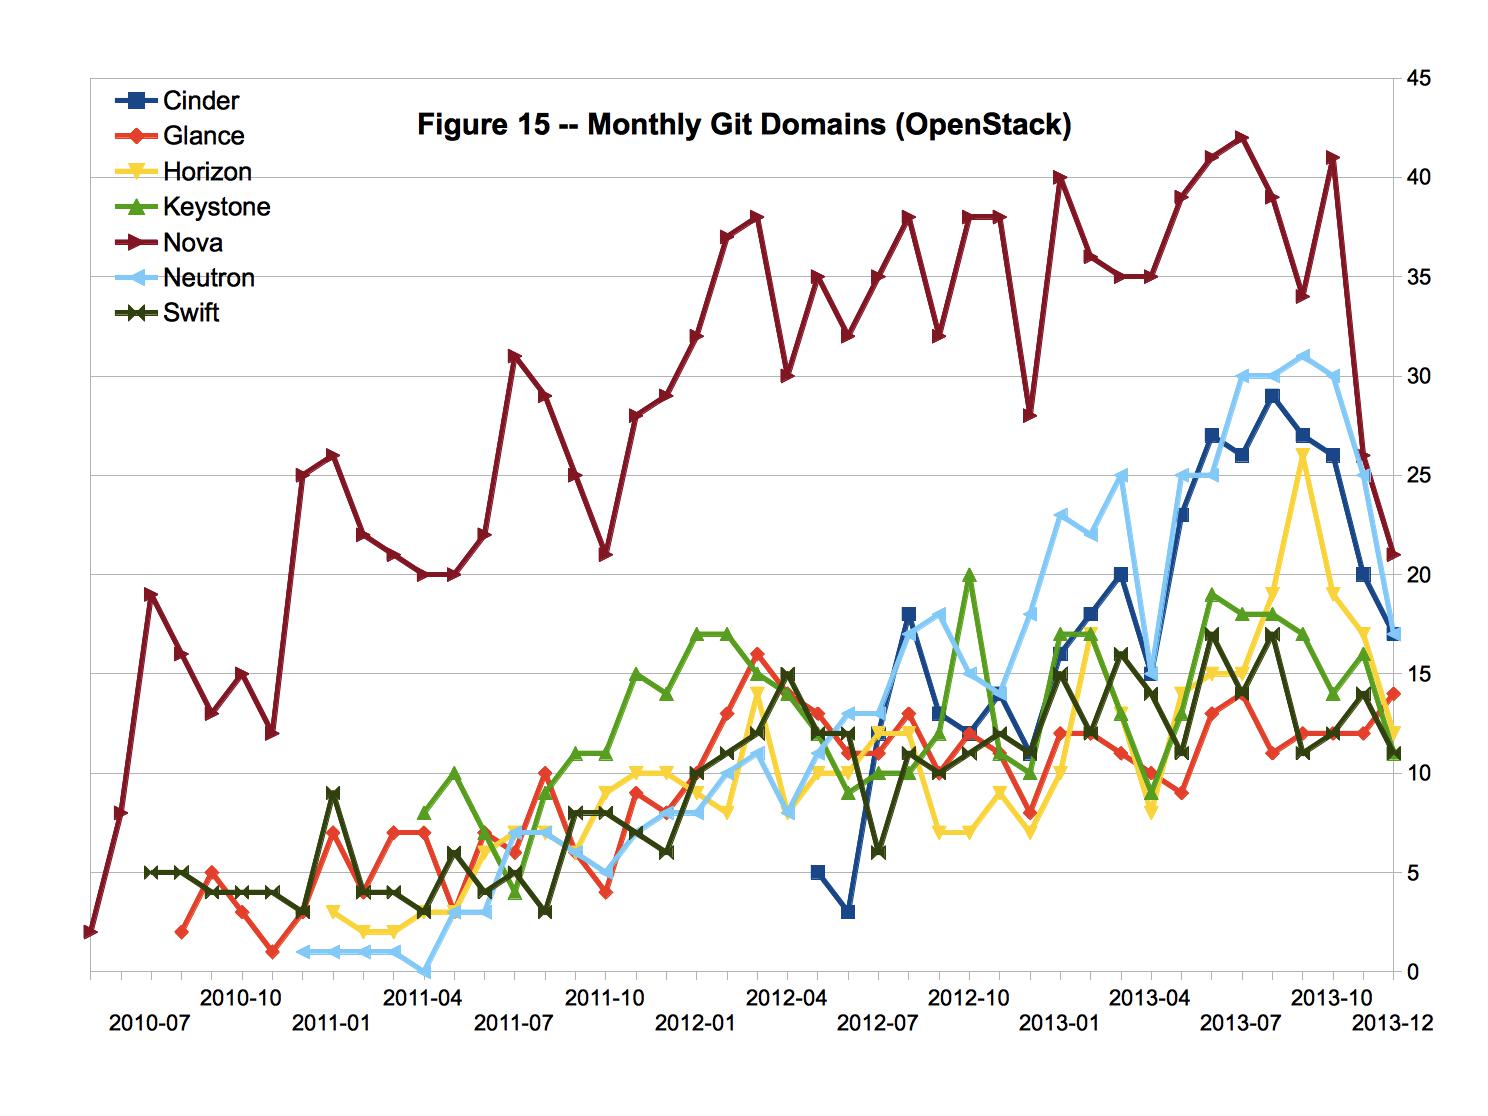
图15所示分别是OpenStack项目中各个子项目每个月提交代码(commit操作)的域名数量。总体来看,Nova子项目提交代码的域名数量较多,是其他几个子项目的三倍左右。
下面这个表格以电子邮件所属域名的形式列出了在CY13-Q4期间向CloudStack、Eucalyptus、OpenNebula和OpenStack项目贡献代码次数最多的机构(以及贡献代码次数的百分比)。可以看出,Eucalyptus和OpenNebula属于以单一机构为主导的开源项目,而CloudStack和OpenStack属于由多家机构共同合作的开源项目。对于CloudStack项目来说,来自Citrix的影响依然非常明显,直接来自citrix.com和cloud.com的邮件地址占了41%(与CY13-Q3相比较降低了7%)。对于OpenStack项目来说,来自RedHat的贡献占了16%,来自IBM的贡献占了10%,来自Rackspace、Mirantis、HP、Suse的贡献各占了4%,来自eNovance的贡献各占了2%。值得一提的是,来自华为的贡献占了1%。
| CloudStack | Eucalyptus | OpenNebula | OpenStack | ||||
| Domain | % | Domain | % | Domain | % | Domain | % |
| citrix.com | 39 | eucalyptus.com | 77 | opennebula.org | 98 | redhat.com | 16 |
| gmail.com | 20 | gmail.com | 21 | cuesoft.eu | 0.6 | gmail.com | 16 |
| apache.org | 15 | fedoraproject.org | 1 | ibm.com | 10 | ||
| clogeny.com | 6 | openstack.org | 8 | ||||
| shubergphilis.com | 5 | rackspace.com | 4 | ||||
| leaseweb.com | 3 | mirantis.com | 4 | ||||
| cloud.com | 2 | hp.com | 4 | ||||
| netapp.com | 1 | suse.de | 4 | ||||
| betterservers.com | 1 | enovance.com | 2 | ||||
| cloudops.com | 0.6 | huawei.com | 1 | ||||
下面这个表格以电子邮件所属域名的形式列出了在CY13-Q4期间向OpenStack项目各个子项目贡献代码最多的机构(以及贡献代码次数的百分比)。
| Cinder | Glance | Horizon | Keystone | ||||
| Domain | % | Domain | % | Domain | % | Domain | % |
| redhat.com | 16 | ibm.com | 20 | gmail.com | 23 | ibm.com | 25 |
| huawei.com | 13 | gmail.com | 15 | redhat.com | 12 | dstanek.com | 15 |
| gmail.com | 11 | enovance.com | 10 | hp.com | 12 | redhat.com | 11 |
| openstack.org | 9 | mirantis.com | 8 | sheep.art.pl | 10 | gmail.com | 7 |
| ibm.com | 8 | yahoo.com | 7 | da.jp.nec.com | 6 | metacloud.com | 7 |
| solidfire.com | 7 | rackspace.com | 7 | intel.com | 6 | dreamhost.com | 7 |
| netapp.com | 4 | dmllr.de | 6 | openstack.org | 4 | openstack.org | 4 |
| hp.com | 3 | openstack.org | 4 | mirantis.com | 3 | huawei.com | 3 |
| dmllr.de | 2 | mxa.nes.nec.co.jp | 4 | enovance.com | 3 | hp.com | 2 |
| ebaysf.com | 2 | hp.com | 3 | ibm.com | 1 | ifca.unican.es | 1 |
| Nova | Neutron | Swift | |||||
| Domain | % | Domain | % | Domain | % | ||
| ibm.com | 23 | openstack.org | 18 | swiftstack.com | 24 | ||
| redhat.com | 23 | gmail.com | 17 | gmail.com | 19 | ||
| gmail.com | 11 | mirantis.com | 8 | redhat.com | 19 | ||
| rackspace.com | 4 | nicira.com | 7 | not.mn | 7 | ||
| vmware.com | 4 | redhat.com | 7 | enovance.com | 5 | ||
| hp.com | 3 | ibm.com | 4 | brim.net | 4 | ||
| intel.com | 3 | unitedstack.com | 4 | kotori.zaitcev.us | 3 | ||
| openstack.org | 2 | da.jp.nec.com | 3 | hgst.com | 2 | ||
| stillhq.com | 2 | cisco.com | 3 | rackspace.com | 2 | ||
| codestud.com | 1 | enovance.com | 2 | weirdlooking.com | 1 | ————————- | — |
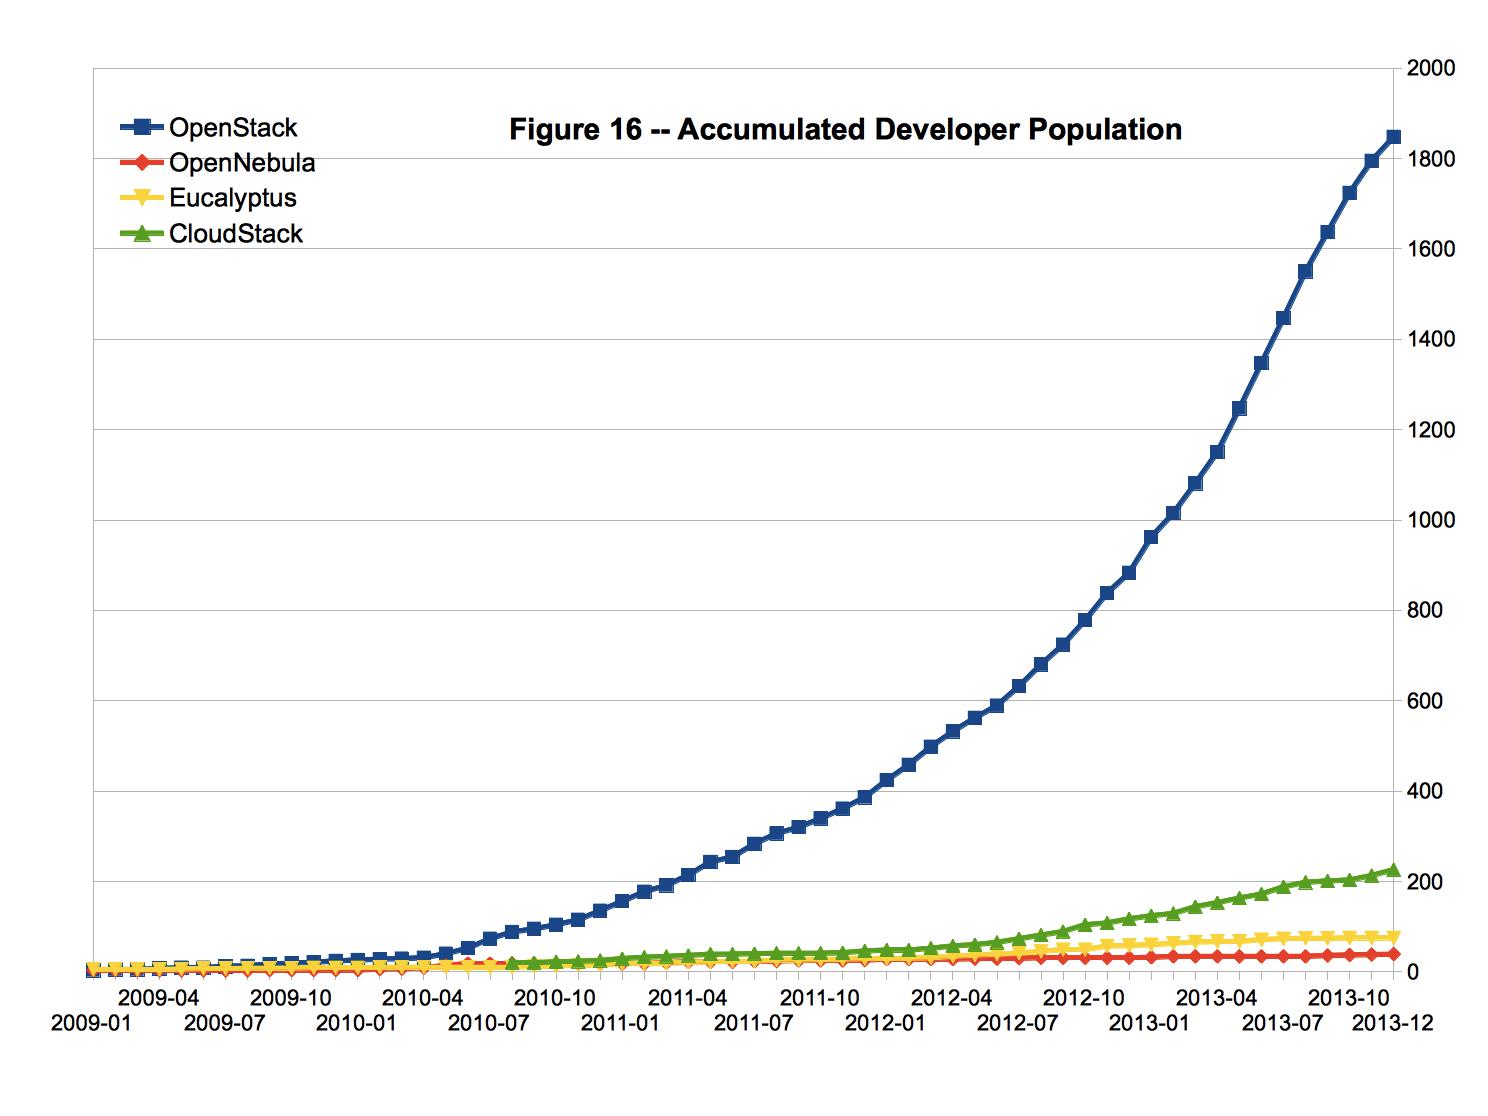
累计开发者人口指的是曾经向某个项目提交过代码的开发者总数。图16所示为这四个项目的开发者人口增长趋势。可以看出,OpenStack项目的累计开发者人口最大,是第二名CloudStack的10倍左右。
我们还计算了上个季度活跃的开发者与累计开发者人口之比。分别是OpenStack 37.1%,CloudStack 35.4%,OpenNebula 25.6%,Eucalyptus 22.7%。
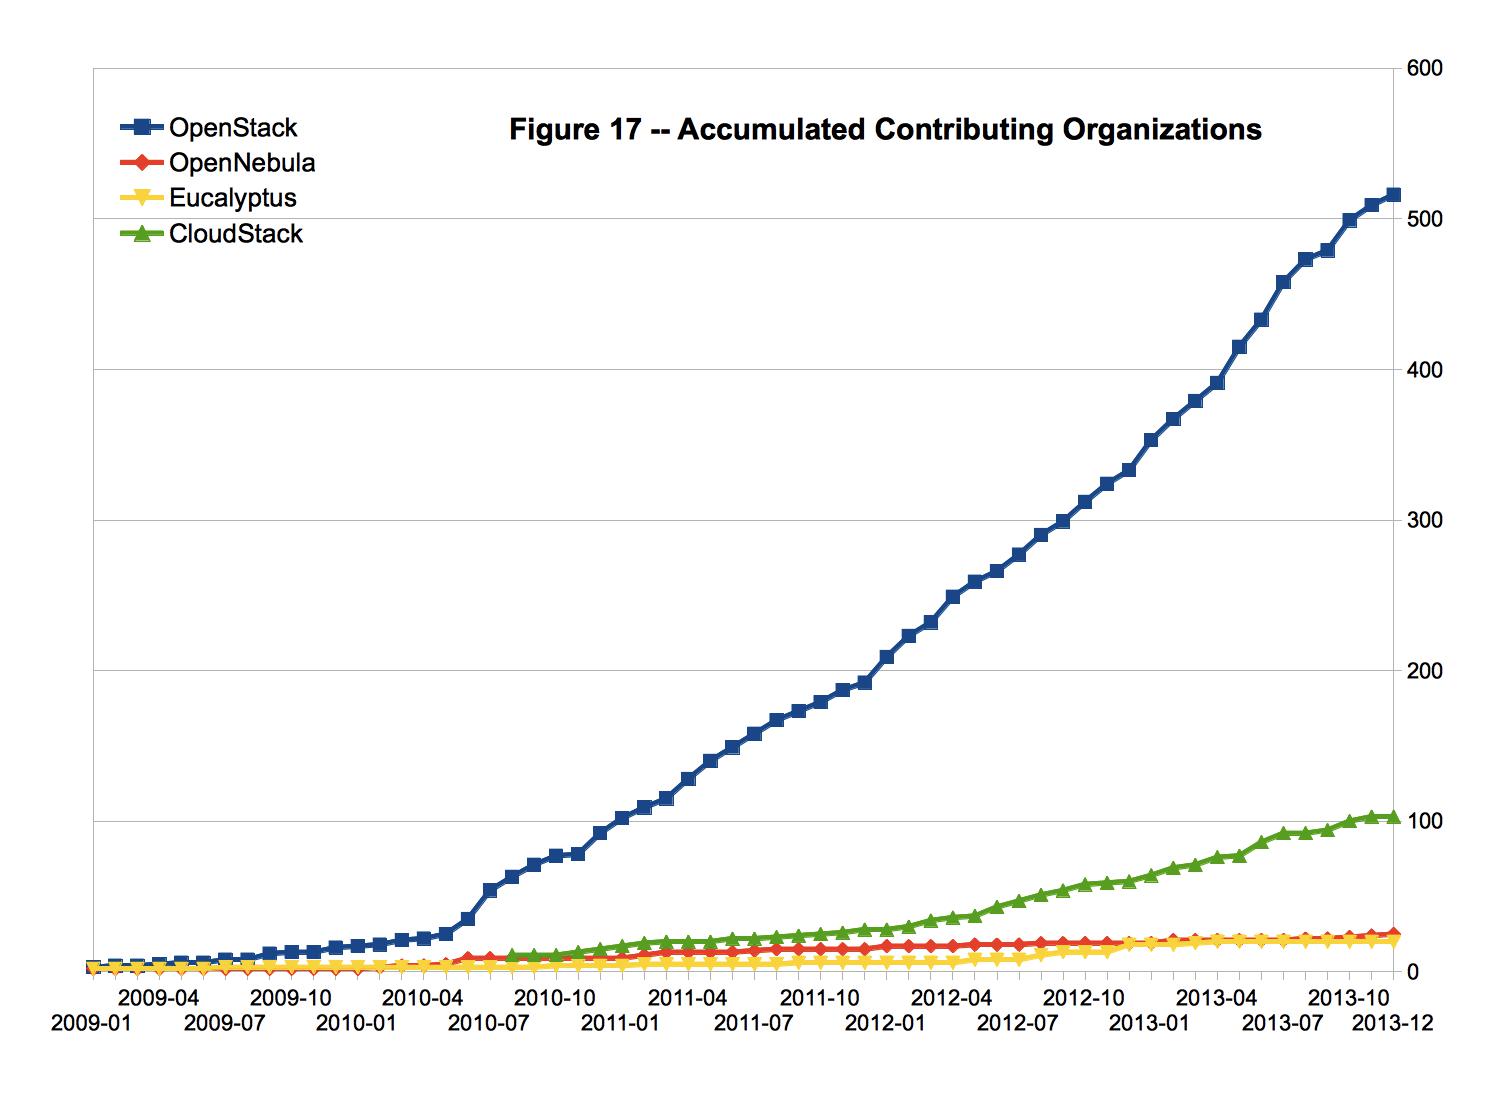
累计贡献机构数量指的是曾经向某个项目提交过代码的机构数量。图16所示为这四个项目的累计贡献机构数量增长趋势。可以看出,OpenStack项目的累计贡献机构数量最多,是CloudStack和Eucalyptus的5倍左右。OpenNebula的累计贡献机构数量相对较少。
我们还计算了上个季度活跃的贡献机构与累计贡献机构数量之比。分别是OpenStack 32.6%,CloudStack 26.2%,OpenNebula 24.0%,Eucalyptus 20%。
与本文相关的PDF版本幻灯片可以从这里下载。如果您需要重新分发本文内容,敬请您保留相关作者信息。
CY13-Q4 Community Analysis — OpenStack vs OpenNebula vs Eucalyptus vs CloudStack
| 发表时间:2014-01-02 21:39:36 | 评论:9 |
This article is an update version of my previous article CY13-Q3 Community Analysis — OpenStack vs OpenNebula vs Eucalyptus vs CloudStack. Readers who are intested in further discussions please contact me via email at the above-mentioned address.
A Chinese version of this article is published at the same time, which can be found at CY13-Q4 OpenStack, OpenNebula, Eucalyptus, CloudStack社区活跃度比较.
This community analysis project was initiated in CY11-Q4, and this particular report is the 9th quarterly report being published since. The author served shortly as the Director of Customer Success in China for Eucalyptus Systems Inc during October 2012 and July 2013. However, the opinion presented in this report belongs strictly to the author rather than any current or previous employer of the author.
The objective of this quarterly report is to compare the OpenStack, OpenNebula, Eucalytpus and CloudStack user and developer communities, base on the communications between community members in the form of mailing lists or pubic forum discussions. The data being discussed include the total number of topics (threads), messages (posts), and participants (unique email addresses or registered members). To obtain the above-mentioned data, a Java program was written to retrieve all the forum posts and mailing list messages into a MySQL database for further processing. The analysis results were presented in the form of graphs generated by LibreOffice.
During the past several years, some of the early forums and mailing lists became EOL’ed and were no longer accessible. The MySQL database that was built at the beginning of this project, as well as the previous versions of this quarterly report, make it possible to carry out analysis since the beginning of each project.
For projects with multiple membership systems (such as a forum and a mailing list), extensive efforts were carried out to eliminate membership double counting (counting one person twice or more in the statistics).
Figure 1 and 2 represent the monthly number of topics (threads) and posts (messages). It can be seen that
(1) During the past 12 months, OpenStack-related discussions and CloudStack-related discussions were approximately on the same level, while Eucalyptus-related discussions and OpenNebula-related discussions were approximately on the same level.
(2) During the past 12 months, the volume of OpenStack and CloudStack related discussions were much higher than that of Eucalyptus and OpenNebula.
Generally speaking, the number of replies to a specific topic represents the attention being received, and the depth of discussion for that particular topic. When the number of master posts (the original post that started a particular topic) is more than the number of replies, it is safe to conclude that the participation of the forum or mailing list is very low. Therefore, the ratio between “the number of posts” and “the number of topics” represents the participation rate of an online community. In this study we call this ratio the Participation Ratio.
As can be seen from Figure 3, during the past 12 months the participation ratios of CloudStack and Eucalyptus were relatively higher, which were close to 4; the participation ratios of OpenStack and OpenNebula were relatively lower, which were a little bit higher than to 2.
We do notice that the concept of “participation ratio” generated some disagreements. Some people think that a lower “post-to-thread ratio” represents the ability to resolve problems in a very short time, therefore only a very limited number of discussions are needed. Some people think that a higher “post-to-thread ratio” might be an indicator that the community are on flame, and during a flame a large portion of the posts might be off-topic. Anyway, we agree that when we call this parameter “participation ratio” it somewhat represents our own opinion and it undermines the objectiveness of this report. However, because we do not find a better name to represent this parameter, we will just use it for the time being. (Dear readers, you are more than welcome to contribute a better name for this parameter.)
Figure 4 shows the number of monthly participants of the four projects being discussed. It can be seen that the number of active participants of OpenStack is much higher than the other three projects. The number of active participants of CloudStack is also significantly higher than OpenNebula and Eucalyptus. During the past 12 months, the number of active participants for OpenStack and CloudStack were growing steadily (100% growth for OpenStack, and 50% growth for CloudStack), while the number of active participants for Eucalyptus and OpenNebula exhibited no significant growth.
It should be noted that although the number of active participants of the CloudStack project is somewhat smaller than that of the OpenStack project, both projects have approximately the same amount of discussions (as shown in Figure 1 and Figure 2).
Accumulated Community Population refers to the total number of users and developers who have participated in forum or mailing list discussions. (This number does not include those who have registered into discussion forums or mailing lists but have never participated in any open discussions.) These are people who have tested or used a specific product for a while, but not necessary currently an active user.
Figure 5 shows the growth of the accumulated community populations of these 4 projects. Currently OpenStack has the larges accumulated community population, followed by Eucalyptus, CloudStack, and OpenNebule.
The problem is, after years of changes, a long-term (such as 4 to 5 years) accumulated community population might not be a good reference for community activeness. Some of the early members of one community might have switched to other communities (and probably more than once), some of the early community medium (such as mailing lists and forums) might have become EOL’ed. From a community analysis point of view, it might be better to count the accumulated community population of the past 6 to 12 months, while extending the range to the dinosaurs age will make this parameter meaningless.
Figure 6 shows the monthly population growth of the four projects being discussed. During the past 6 months, the populations of OpenStack is growing much faster than the other three projects. CloudStack is also exhibiting significant growth, but not as fast as OpenStack.
The populations of Eucalyptus and OpenNebula are growing at relatively slow paces, as compared to CloudStack and OpenStack.
Figure 7 is a combination of Figure 4 and Figure 6. The solid lines represent the monthly participants, while the dash lines represent the monthly new members.
During the past 12 months, for OpenStack and CloudStack, around 30% of their monthly participants are new members. For OpenNebula and Eucalyptus, around 50% of their monthly participants are new members. This indicates OpenStack and CloudStack communities are becoming more “sticky” than OpenNebula and Eucalyptus communities.
Figure 8 shows the total community population, active participants of the past quarter, and active participants of the past month, of the four projects being discussed. It can be seen that
(1) OpenStack has the largest total population, followed by Eucalyptus, CloudStack, and OpenNebula;
(2) OpenStack has the largest active population during the past quarter, followed by CloudStack, Eucalyptus, and OpenNebula;
(3) OpenStack has the largest active population during the past month, followed by CloudStack, Eucalyptus, and OpenNebula.
We also calculated the ratio of active population during the past quarter over total population. The result is 32.4% for OpenStack, 21.3% for CloudStack, 10.5% for OpenNebula, and 4.8% for Eucalyptus. Obviously a significant portion of OpenStack and CloudStack users choose to stay, while the majority of Eucalyptus users decide to leave. Such observation is in accordance with what we saw in Figure 7 - OpenStack and CloudStack communities are more “sticky” than OpenNebula and Eucalyptus communities.
In our CY12-Q3 report, we invented the concept of “Community Activeness Index”. Starting from CY13-Q3, we make some minor revision to this parameter, and it is now the combination of the following parameters:
(1) quarterly messages, which represents the volume of the discussions;
(2) quarterly participation ratio, which represents the average number of answers to a question; and
(3) active population of the past quarter, which represents the possibility to get help from community in the long term.
In this analysis, we choose the average values of these parameters as the reference data set, and compare the corresponding parameters of each community with the reference data set. Then we call the sum of the relative values of a community the “community activeness index” of the community. Now we can say the project with the highest “community activeness index” is THE most active project in this area.
As can be seen from Figure 9, OpenStack is currently THE most active project (with obvious advantage), followed by CloudStack, OpenNebula, and Eucalyptus.
We are seeing increasing number of suggestions to analyze the git activities of these open source IaaS projects. We also noticed that all of these four projects use git as the SVM for their source code. Starting from our CY13-Q1 report, we tried to do some basic analysis base on the git log data. It should be noted that for the OpenStack project, the data source includes all the sub-projects under openstack (57 sub-projects) and openstack-infra (33 sub-projects) on github.com.
In our CY13-Q1 report, we used “git log” to obtain log information. Starting from CY13-Q2, we will use “git log –no-merges” to obtain log information.
It should be pointed out that git is a distributed versioning system. With git, developers work with their own local repositories. When a developer executes a commit operation, the code changes are make to the local repositories, and will not be reflected in the master repository until such commits are pushed to and merged with the master repository. It is common practice that developers tend to accumulate many commits before they feel comfortable to make a push. Therefore, some of the recent commits might not get counted towards this analysis. Based on our observations, there exists about 50% under estimation in the number of commits for the previous month, and about 20% under estimation in the number of commits for the month before.
Figure 10 shows the monthly number of commit operations for these four projects. Generally speaking, the commit frequency of OpenStack is much higher than the commit frequencies of the other three projects. This is because the data source for OpenStack includes a total number of 90 sub-projects, which is far greater than the other three projects. The commit frequency of CloudStack is also significantly higher than Eucalyptus and OpenNebula. As compared to OpenNebula, Eucalyptus was also committing more frequently, but with significant fluctuations from month to month, which seems to be a typical batch-commit behavior. The commit frequency of the OpenNebula project is relatively small, with an average of 200 commits per month.
Figure 11 shows the monthly number of commit operations for the sub-projects of OpenStack. Generally speaking, the commit frequency of the Nova sub-project is about 3 times as high as the other sub-projects. It should be noted that although the commit frequency of these sub-projects are different, but they exhibit similar time-series curves, and their highs and lows occur at the same period of time. This indicates that although these sub-projects are relatively independent, but they work around the same development plan and the same release schedule. This is an indicator that the OpenStack project is well organized in terms of sub-project management.
Figure 12 shows the monthly number of contributors (identified by unique email addresses) for these projects. Generally speaking, the number of OpenStack contributors is much higher than the other three projects, and is growing rapidly. The number of CloudStack contributors also exhibits some growth, but the growth is relatively slow. The number of Eucalyptus and OpenNebula contributors is relatively small, and does not exhibit growth during the past 12 months.
Figure 13 shows the monthly number of contributors (identified by unique github.com accounts) for the sub-projects of OpenStack. It can be seen that the number of Nova contributors is about 3 times as big as the other sub-projects.
People usually try to identify the institute to which a contributor belongs to by his/her email address. It is true that such method is defect in nature (different institutes have different policies regarding contributing to open source projects, some institutes even encourage their employees to contribute to open source projects with their personal account), but still this parameter can be used to show the contributions of certain institutes to certain open source projects. Figure 14 shows the monthly number of unique institutes (identified by the domain name of the contributor’s email address) contributing to these projects. We can see that the number of contributing institutes for OpenStack is much larger than the other three projects, and is growing rapidly. The number of contributing institutes for CloudStack is also growing, but at a relatively slow pace. The number of contributing institutes to Eucalyptus and OpenStack is relatively small, and does not exhibit any growth during the past 12 months.
Figure 15 shows the monthly number of contributing institutes to the sub-projects of OpenStack. It can be seen that the number of contributing institutes for Nova is about 3 times as big as the other sub-projects.
The following table lists those institutes that make the most contributions to these projects during CY13-Q4, according to the number of commit operations, along with the percentage of their commit operations. It can be seen that both Eucalyptus and OpenNebula are open source projects dominated by single institutes, while CloudStack and OpenStack are open source projects contributed by multiple institutes. For the CloudStack projects, influence from Citrix is still quite obvious, over 41% of the commits come from accounts belonging to citrix.com and cloud.com (7% decrease as compared to CY13-Q3). For the OpenStack project, redhat.com contributed to 16% of the commits, while ibm.com contributed 10% of the commits. Rackspace.com, mirantis.com, hp.com and suse.de contributed another 4% of the commits each. It should be pointed out that huawei.com (headquartered in China) contributed 1% of the commits.
| CloudStack | Eucalyptus | OpenNebula | OpenStack | ||||
| Domain | % | Domain | % | Domain | % | Domain | % |
| citrix.com | 39 | eucalyptus.com | 77 | opennebula.org | 98 | redhat.com | 16 |
| gmail.com | 20 | gmail.com | 21 | cuesoft.eu | 0.6 | gmail.com | 16 |
| apache.org | 15 | fedoraproject.org | 1 | ibm.com | 10 | ||
| clogeny.com | 6 | openstack.org | 8 | ||||
| shubergphilis.com | 5 | rackspace.com | 4 | ||||
| leaseweb.com | 3 | mirantis.com | 4 | ||||
| cloud.com | 2 | hp.com | 4 | ||||
| netapp.com | 1 | suse.de | 4 | ||||
| betterservers.com | 1 | enovance.com | 2 | ||||
| cloudops.com | 0.6 | huawei.com | 1 | ||||
The following table lists those institutes that make the most contributions to the sub-projects of OpenStack during CY13-Q4, along with the percentage of their commit operations.
| Cinder | Glance | Horizon | Keystone | ||||
| Domain | % | Domain | % | Domain | % | Domain | % |
| redhat.com | 16 | ibm.com | 20 | gmail.com | 23 | ibm.com | 25 |
| huawei.com | 13 | gmail.com | 15 | redhat.com | 12 | dstanek.com | 15 |
| gmail.com | 11 | enovance.com | 10 | hp.com | 12 | redhat.com | 11 |
| openstack.org | 9 | mirantis.com | 8 | sheep.art.pl | 10 | gmail.com | 7 |
| ibm.com | 8 | yahoo.com | 7 | da.jp.nec.com | 6 | metacloud.com | 7 |
| solidfire.com | 7 | rackspace.com | 7 | intel.com | 6 | dreamhost.com | 7 |
| netapp.com | 4 | dmllr.de | 6 | openstack.org | 4 | openstack.org | 4 |
| hp.com | 3 | openstack.org | 4 | mirantis.com | 3 | huawei.com | 3 |
| dmllr.de | 2 | mxa.nes.nec.co.jp | 4 | enovance.com | 3 | hp.com | 2 |
| ebaysf.com | 2 | hp.com | 3 | ibm.com | 1 | ifca.unican.es | 1 |
| Nova | Neutron | Swift | |||||
| Domain | % | Domain | % | Domain | % | ||
| ibm.com | 23 | openstack.org | 18 | swiftstack.com | 24 | ||
| redhat.com | 23 | gmail.com | 17 | gmail.com | 19 | ||
| gmail.com | 11 | mirantis.com | 8 | redhat.com | 19 | ||
| rackspace.com | 4 | nicira.com | 7 | not.mn | 7 | ||
| vmware.com | 4 | redhat.com | 7 | enovance.com | 5 | ||
| hp.com | 3 | ibm.com | 4 | brim.net | 4 | ||
| intel.com | 3 | unitedstack.com | 4 | kotori.zaitcev.us | 3 | ||
| openstack.org | 2 | da.jp.nec.com | 3 | hgst.com | 2 | ||
| stillhq.com | 2 | cisco.com | 3 | rackspace.com | 2 | ||
| codestud.com | 1 | enovance.com | 2 | weirdlooking.com | 1 | ————————- | — |
Accumulated Developer Population refers to the total number of developers who have contributed code to a particular project (as reflected in git commits). Figure 16 shows the growth of the accumulated developer populations of these 4 projects. Currently OpenStack has the largest accumulated developer population, which is about 10 times bigger than the distant number 2 CloudStack.
We also calculated the ratio of active developers during the past quarter over accumulated developer population. The result is 37.1% for OpenStack, 35.4% for CloudStack, 25.6% for OpenNebula, and 22.7% for Eucalyptus.
Accumulated Contributing Organizations refers to the total number of organizations (as reflected in unique domain names associated with developer email addresses) who have contributed code to a particular project (as reflected in git commits). Figure 17 shows the growth of the accumulated contributing organizations of these 4 projects. Currently OpenStack has the largest number of contributing organizations, which is 5 times larger than CloudStack and Eucalyptus. OpenNebula has the smallest number of contributing organizations.
We also calculated the ratio of active contributing organizations during the past quarter over accumulated contributing organizations. The result is 32.6% for OpenStack, 26.2% for CloudStack, 24.0% for OpenNebula, and 20% for Eucalyptus.
For your convenience, a PDF version of this presentation can be downloaded from here. Please kindly keep the author information if you want to redistribute the content.
从王博士说起
| 发表时间:2013-12-25 21:58:38 | 评论:15 |
不知道为啥,最近几天频繁看到关于王博士的文章,便有了一些从王博士说起的思绪。认真说来,我与王博士不算熟悉,将来也不会有深入交流的机会。因此,这篇文章与其说是谈王博士,不如说是以王博士为引子谈一谈云计算。
如果Google没有搞错的话,王博士是2008年加盟阿里的。在这之前,我对阿里的唯一印象,却是下面的这一桩小事。
2007年5 月,阿里在杭州举办首届中国网络工程师侠客行大会。一位名为Andy的技术负责人与Sun 公司ISV部门联系,请Sun 公司推荐一位Java领域的讲师。当时我在Sun 公司负责中国地区的开发者社区工作,这个任务几经辗转就落到了我的头上。阿里方面的本意,大概是希望邀请到James Gosling前来参会,但是James Gosling在那个时间段已经有了别的安排。在公司的牛棚里头转了一圈之后,我向阿里推荐了Java EE团队的杰出工程师(Distinguished Engineer)Mark Hapner,阿里方面欣然接受。但是Mark Hapner任职于没有差旅预算的研发团队,因此我向Andy的秘书询问阿里方面是否可以解决Mark Hapner的往返机票和酒店费用。Andy的秘书回答说阿里方面可以安排酒店,但是机票需要Sun 公司先买,然后再向阿里报销。由于不需要Sun 公司支付差旅费用,Mark Hapner就自己刷信用卡买了机票,从三藩飞到杭州做了个讲座,第二天又飞回三藩上班。问题是我向Andy的秘书提起报销Mark Hapner的机票费用时,小姑娘改口说是国际机票太贵只能为演讲者报销一半,剩下的一半需要演讲者自理,以前往返邮件里面的白纸黑字做不得数了。又经过几轮邮件沟通,干脆就再也不回邮件,连说过的一半也没了下文。到了年底,我实在不好意思欠同事的人情,就自掏腰包通过PayPal把机票钱还给了Mark Hapner。
之所以提起这一陈年旧事,只是想帮助各位客官了解一个事实。如今阿里的技术团队声名远扬如日中天,但是在王博士加盟阿里之前,阿里并不是一个尊重技术人才的公司。也正因为如此,没有学过心理学的其他大牛(譬如传说中的陆奇)在阿里根本没有可能谈到预期的薪水。王博士加盟阿里之后,在提高工程师地位和待遇方面做了很多工作。用吴翰清的一句话说,“王博士是唯一一个能把技术讲得连马云都能听懂的人”。平心而论,在提高工程师地位和待遇这个事情上,很多技术VP都做了大量工作。不过,如果不是王博士能够把技术讲得连马云都能听懂,今天的阿里对技术人员的吸引力可能就会大打折扣。所以我建议阿里内部的工程师在批评王博士的时候,可以尝试着用一下“虽然...但是...”这个句式。
据说王博士是打着云计算的旗号混进阿里的。在那个时间点上,“云计算”这个词还没有现在这般炙手可热,并且通常用来指代类似于网格(使用N 台物理机虚拟出一个具有超级计算或者存储能力的系统,用户通过命令行或者Web界面向系统提交计算或者存储任务)而不是类似于AWS(在单台物理机上虚拟出N 台物理机,用户通过命令行、API、或者Web界面获得虚拟机资源)的系统。那时候AWS发布才两年时间,在国内并没有引起很大的反响。国内互联网公司的系统团队更关心的是类似于vCenter的数据中心虚拟化,而不是类似于AWS的自助服务模式(关于数据中心虚拟化和自助服务模式的区别,可以参考我在2012年10月写的一篇博客《虚拟化、云计算、开放源代码及其他》)。在国外,第一个提供类似AWS功能的软件是闭源的Enomaly(2009年7 月),然后是开源的Eucalyptus(2009年11月)。2010年上半年,王博士已经开始试图在阿里内部推广(并且遭到了顽强的抵抗)自己轮出来的后羿(也就是阿里云的前身)了。考虑到产品设计和研发的周期,可以推测出王博士启动后羿项目的时机应该与Enomaly和Eucalyptus差不了多少。那时CloudStack和OpenNebula都还是单纯的数据中心虚拟化管理软件,而现在大名鼎鼎的OpenStack(起始于2010年7 月)还没有生出来。单从这一点来看,王博士不仅不是在重复发明轮子,而是极具远见和魄力了。
我所理解的远见,或者说是方向感,大概就是模模糊糊地看到未来的一个缩影,但是并不清楚要达到那个境界需要经过哪些步骤。我们通常把在企业里面的人分为两类,一类是战略型(或者说务虚型)的,另外一类是战术型(或者说务实型)的。这两类人的共同特征是互相看不起,战略型的人认为战术型的人没见识,战术型的人觉得战略型的人瞎扯淡。对于中小型公司来说,战略型的人太多通常意味着一场灾难。对于大型公司来说,战略型的人则是一把双刃剑 - 他有可能把公司给带到沟里,也有可能让公司实现第二次腾飞。王博士应该是一种典型的战略型人才,他早早地看到了云计算在未来的重要性,并且预见到要把远景变成现实道阻且长。吴翰清在博客里说:“我最佩服王博士的是无论他被外面的人、下面的人、其他BU的老大们骂的有多惨,鄙视的有多厉害,他总能不露声色,该做什么就做什么,和我们聊天时还能跟没事的人一样。”这样的人,才真真是能够做大事的人。
但是光靠王博士一个战略型人才绝对是做不成云计算的。王博士开始疯狂地在阿里内部挖人,一直挖到兄弟部门怨声载道,然后又“不设上限”地从外头招人。我同意王博士一开始不应该招那么多微软的人这样的看法,因为微软已经是一家美人迟暮型公司,培养出来的人大都是战略型人才,和王博士是同一类型但是水平又远远没有王博士那么高。从Google挖人的愿景很美好但是可行性较低,因为当时市场的薪资水平是微软小于阿里小于Google,并且进得去Google的人看得起土豪的也不多。(插播一下广告:章文嵩在2009年9 月加盟淘宝,只能够说是阿里捡到宝了。)在这样的背景下,王博士早期的团队缺乏高端的战术型人才,走一些弯路也在所难免。但是到了今年,王博士早期的一些努力开始取得了初步的效果。其中一例,是去IOE的巨大成功;另外一例,则是聚石塔在今年的双11中大显身手。这两个例子,其实都可以归结为云计算理念的成功。王博士从今年9 月起不再担任阿里云总裁一职,未来专注于CTO一职。不过,如果现在就试图去评价王博士对阿里云所起的作用的话,我个人觉得还是为时过早了。
目前我们所说的云计算,基本上就是以虚拟机的形式提供计算资源,谁需要计算资源的时候就买一个,不再需要的时候就把它杀掉。按需获取,按量计费,节能减排,自主可控,安全高效,这些词语市场和销售人员都背的滚瓜烂熟,熟得让人不敢相信这有可能是真的。但是我不仅认为这些口号都是真的,并且相信云计算的未来远远不止于此。我在《虚拟化、云计算、开放源代码及其他》这篇博客里面提到了英国经济学家威廉杰文斯(Willian Jevons,1835-1882)在《煤矿问题》(The Coal Question)一书中指出的一个似乎自相矛盾的现象:蒸汽机效率方面的进步提高了煤的能源转换率,能源转换率的提高导致了能源价格降低,能源价格的降低又进一步导致了煤消费量的增加。这种现象称为杰文斯悖论,其核心思想是资源利用率的提高导致价格降低,最终会增加资源的使用量。在过去150年当中,杰文斯悖论在主要的工业原料、交通、能源、食品工业等多个领域都得到了实证。我在这篇博客里面又进一步断言:“公共云计算服务的核心价值,是将服务器、存储、网络等等硬件设备从自行采购的固定资产变成了按量计费的公共资源。虚拟化技术提高了计算资源的利用率,导致了计算资源价格的降低,最终会增加计算资源的使用量。”。
如果说云计算使得用户可以象用电用水一样使用计算资源,那么最终会达到什么效果呢?看一看我们平时用电用水的情况,哪些属于刚性(必不可少的)需求,哪些属于柔性(可有可无的)需求。很快你就会发现我们大部分的消费,其实应该归类到柔性需求里面去。我们在房间里装个漂亮的壁灯,不见得是因为没有它就看不见路,而是因为点亮了之后我们变得心情愉快了。我们到游泳池去游泳,不见的是因为家里实在没有地方洗澡。但是,你看看我们现在的云计算用户。他们之所以使用云计算,是因为他们必须使用计算资源去做一些他们认为很重要的事情,他们不是仅仅想要高兴一下就刷卡去买你的云主机。要想让云计算象用电用水一样,至少需要两个前提条件:一是简单,二是便宜。 我想在书桌上加一盏台灯,不需要单独跑到供电公司去签一个合同。我在你这里买一个虚拟机,为什么需要我单独下一个订单呢?我买的台灯想什么时候拆掉就什么时候拆掉,我买的虚拟机你为什么要按天、按星期、甚至是按月计费呢?很多做IDC出身的人会跟你扯什么合同,什么协议,什么ITIL,什么ETOM,你们家换个灯泡还要先跑去供电公司签个合同吗?
所以说,云计算是一场革命。这场革命既是服务提供商的,也是云资源用户的。对于服务提供商来讲,云计算不仅仅是将物理机换成虚拟机,更重要的是提供服务的方式和对服务计费的方式。对于云资源用户来说,要理解虚拟机已经不是传统意义上的服务器,并且学会如何去使用这一新形式的计算资源。想象一下这个场景吧:某个物理系的学生想要验证一下关于宇宙起源的一个新想法,他随手登录进入某某云创建了1000台虚拟机,用了半个小时之后又随手杀掉所有的虚拟机。等什么时候人们不仅仅是因为刚性需求 - 而是因为柔性需求 - 而使用云计算的时候,云计算才能说是真的取得了成功。
所以我说,云计算是一个刚刚显现的蓝海。现在国内各家做公有云的公司杀得你死我活,看起来似乎已经是一片血海。在我看来,这些不过都是假象。现在如果阿里不往这个方向去努力,那才是真的错过了时机。
另:本来还想再写一些关于阿里云的具体的意见,但是考虑到这篇博客本来就是务虚,如果硬要加入一些务实的内容的话,反而不美。
又另:写这篇博客,绝没有在阿里谋求任何职位的意愿。作为一个半路出家的程序员,我深感自己在CS领域的先天不足已经阻碍了我在这个领域的继续发展。因此,过完年之后我就要暂时离开中国,到悉尼大学攻读第二个硕士学位,为期两年。我在悉尼大学的导师是IEEE Fellow Albert Zomaya教授,我的研究内容包括开源社区、云计算经济、云服务可靠度等等内容。
Security - The #1 Concern Behind Amazon Prime Air
| 发表时间:2013-12-03 22:28:32 | 评论:0 |
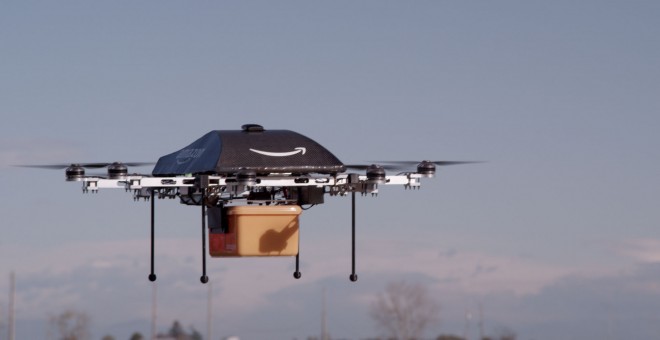
I read, with great interest, all the media reports and commentaries regarding Amazon's ambitious plan to deliver packages with unmanned aviation vehicles (UAV). In the early days of my career, I was exposed to some of the core UAV technologies such as IMU (inertial measurement unit), autonomous guidance and navigation, as well as collision avoidance. I have also the experience of building my own UAV with Sun SPOT - an embedded wireless sensor network (WSN) platform developed by Sun Microsystems five years ago - as the central control unit and FreeWave TDMA modem as the datalink. With all the advancements in WSN, IOT and UAV, I tend to believe that the technology to fly the package to the customer's back yard has already been there, or needs only very little ruggedization and refinement.
In my point of view, the biggest challenge behind Amazon Prime Air is to ensure the security of the UAV itself, which can be further categorized as anti-hijacking and collision avoidance.
Hijacking a UAV might sound impossible at a first glance, but was done at least once. On December 4 2011, an American Lockheed Martin RQ-170 UAV, operated by the Central Intelligence Agency, was hijacked and brought down by an Iranian cyber warfare unit. I am not an expert on hijacking UAV's but I can can think of at least the following approaches:
- Datalink Repression - It is almost certain that the UAV has been designed with the ability to accept and execute navigation and control commands on the fly. In this case, commercial carrier networks (such as AT&T, T-Mobile) seem to be the most convenient (and economically feasible) way to provide the datalink between Amazon and the UAV. In other words, the network being used to transmit guidance, navigation and control (GNC) commands for the UAV's might be the very same network on which people surf the Internet, which is vulnerable to hacker sniffing and attacks. For example, radio repression technologies might be used to cut off the connection between the UAV and the command center, which can pave the road for further malicious attacks.
- GNC Injection - Assuming that a malicious group had access to some UAV's (with brute force such as gun shots), it might not be long for them to reverse engineer the UAV to unveil the underlying GNC protocol. All in a sudden, the whole Amazon fleet is under the control of one (or even more then one) malicious group lurking somewhere waiting for a perfect timing to change the course of the UAV's via GNC injection. Can't believe this? UAV's are computers too, and are vulnerable to virus and human attacks. Remember, NSA infected 50,000 computer networks with malicious software, and so can other malicious groups.
- Location Spoofing - The Amazon UAV's might be using GPS as the primary positioning technique, and each UAV might have a built-in GPS coordinate as its home address. In this case, GPS spoofing might be employed to make the UAV believed that it has arrived at the desired location, and landed in the hands of a malicious group. Therefore, additional technologies such as IMU or WSN should be employed to improve the credibility of the sensed / calculated position of the UAV's.
Collision might not be a problem if Amazon was the only business to obtain a license to operate UAV's for civilian applications. This is very unlikely because FedEx had already expressed similar interests, and there are already a wide range of UAV applications waiting for the approval of FAA. When the number of UAV's increases, the possibility of UAV collision also increases.
For commercial airlines, they fly on pre-designated air ways with pre-determined schedules. There is a global effort trying to keep track of all the airplanes, and prevent them from crashing into each other. On June 30, 1956 two airplanes collided over Grand Canyon with over 100 fatalities. A Wikipedia page on mid-air collision lists 48 civilian mid-air collisions during 1922~2012, with a total number of 2884 fatalities.
For civilian UAV's, the air way network will be a lot more complicated as compared to the commercial airline network. Each and every home address now becomes a potential "airport", and each UAV flight has a unique destination which can't be planned months ahead. New routing algorithms, as well as collision avoidance protocols, will be needed to facilitate these UAV flights.
CY13-Q3 OpenStack, OpenNebula,Eucalyptus,CloudStack社区活跃度比较
| 发表时间:2013-10-03 21:16:05 | 评论:8 |
本文是对《CY13-Q2 OpenStack, OpenNebula,Eucalyptus,CloudStack社区活跃度比较》一文的补充和更新。对本文内容感兴趣的读者,可以通过电子邮件或者新浪微博(@qyjohn_)与我联系。
本文同时发布了一个英文版本,可以参见CY13-Q3 Community Analysis — OpenStack vs OpenNebula vs Eucalyptus vs CloudStack这个帖子。
需要说明的是,这个社区活跃度比较项目起源于CY11-Q4,此篇报告是到目前为止已经发布的第八个季度性的报告。尽管作者于2012年10月至2013年7 月间曾短暂地就职于Eucalyptus公司,但是本文中所表达之观点完全是作者本人的观点,而非作者目前或以前所在公司的观点。
本文的目的是通过论坛和邮件列表的原始数据对OpenStack、OpenNebula、Eucalyptus和CloudStack项目的社区活跃度进 行分析和比较。主要的原始数据是自2009年来这四个项目的官方论坛和邮件列表每个月所产生的讨论主题数、帖子数、以及参与讨论的总人数(邮件地址或者用 户账号)。为了获取这些数据,我写了一个Java程 序自动地从这四个项目的网站下载了所有的论坛和邮件列表信息,并且从这些信息中分析提取出我所需要的数据。程序提取的数据被导入MySQL数据库中以便进 行统计分析,统计分析的结果通过LibreOffice生成分析图表。
从CY13-Q2开始,OpenStack项目启动了一个名为Ask.OpenStack的论坛,我们已经将这个论坛的数据添加到此次分析的数据源当中。值得注意的是,来自Ask.OpenStack的用户和OpenStack其他社区的用户有较大的重合。在此CY13-Q3分析报告中,我们采取了一些初步措施来处理用户重复计数的情况,但是目前尚不能完全避免同一用户重复计数的问题。
此外,Apache CloudStack项目从孵化器毕业,其邮件列表的名称发生了变化,但是其内容和用户基本不变。值得注意的是,原来在incubator-cloudstack-dev邮件列表中有大量由JIRA自动生成的邮件内容,类似的内容在cloudstack-dev邮件列表中大大减少了。不过我们依然保留了以前的过滤器设置,自动地排除了所有标题中含有”[jira]“标识符的信息。
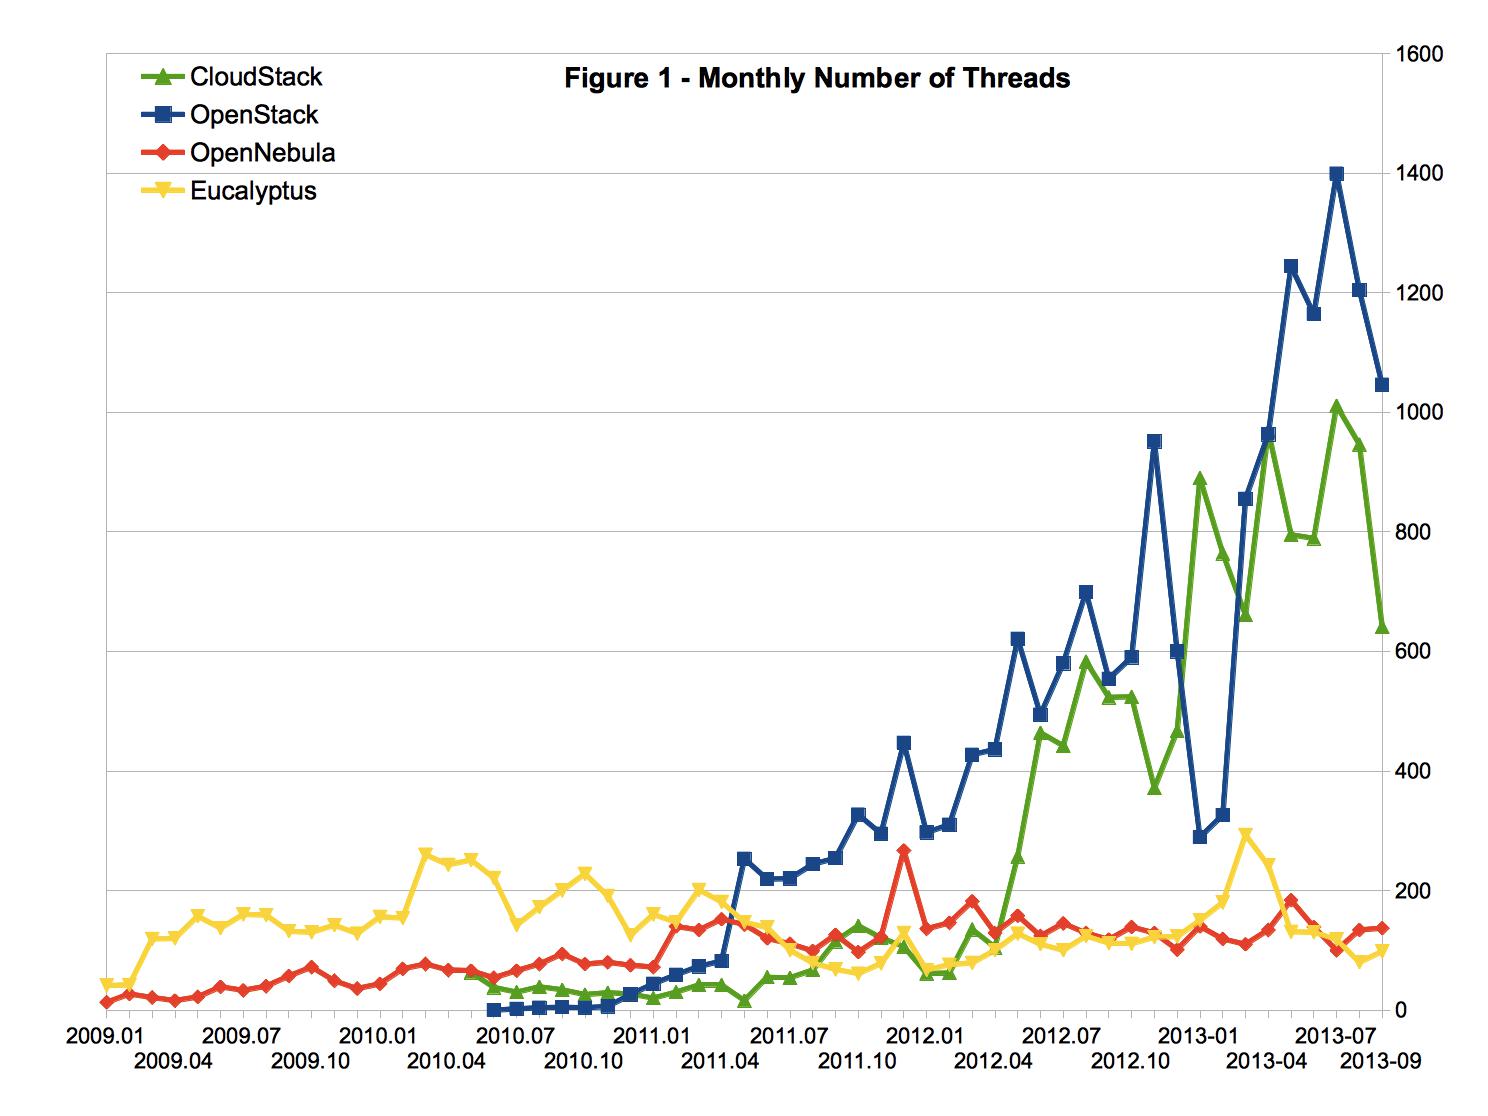
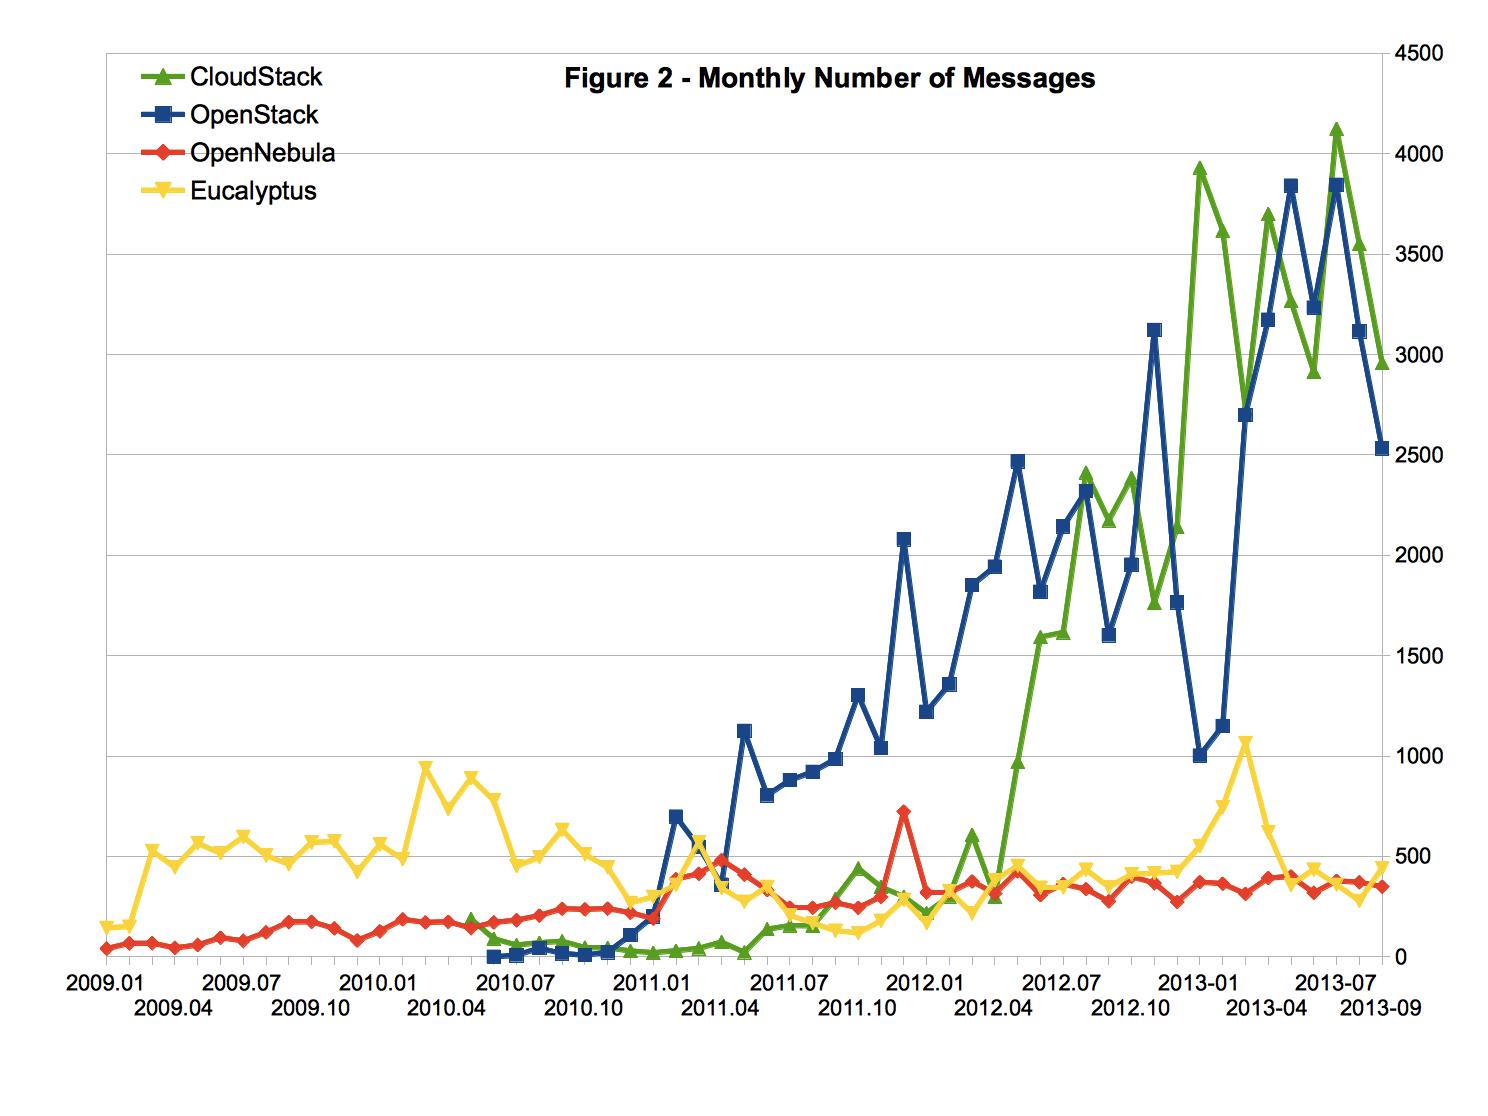
图1 和图2分别是如上所述四个项目每个月所产生的讨论主题数和帖子数。可以看出:
(1) 在过去12个月中,与OpenStack和CloudStack相关的讨论数量在同一水平上,与Eucalyptus和OpenNebula相关的讨论数量在同一水平上;
(2) 在过去12个月中,与OpenStack和CloudStack相关的讨论数量远大于与Eucalyptus和OpenNebula相关的讨论数量。
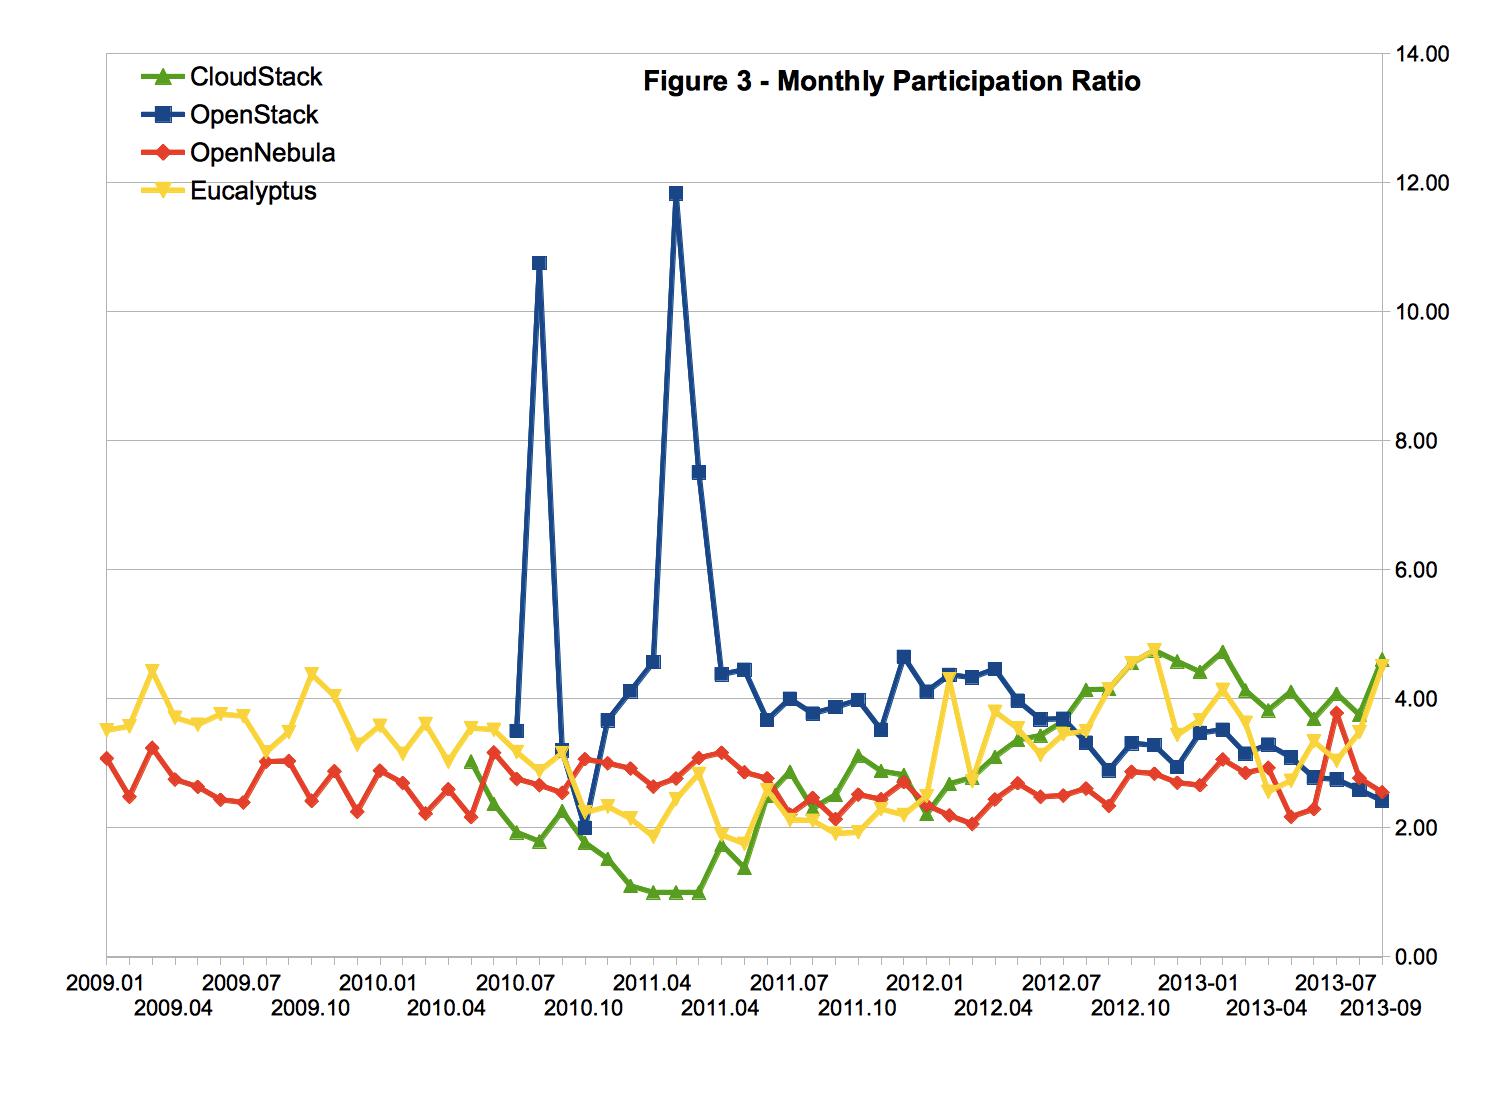
通常来讲,一个讨论主题得到的回复数越多,表明该主题的讨论越深入。一个论坛或者邮件列表如果只有主帖而没有回复,说明这个社区的参与程度很低。因此,平 均意义上的“讨论帖子数/讨论主题数”则反映了一个社区的参与程度,这里我们暂且称之为参与度(Participation Ratio)。
由图3 可以看出,在过去12个月中CloudStack和Eucalyptus项目的参与度相对较高高,接近于4;OpenStack与OpenNebula项目的参与度相对较低,接近于2。
我们也注意到参与度这个概念引起了一些争议。有些人认为“讨论帖子数/讨论主题数”较低象征着某个社区具有快速解决问题的能力,社区成员所提出的问题能够在很短时间内得到解答,因此不需要多个帖子来解决一个问题。有些人认为“讨论帖子数/讨论主题数”较高可能意味着某个社区可能出现了争论,而这种争论可能已经偏离了某个社区的讨论方向和范围。无论如何,参与度这个名称的确反映了我们的某些主观看法,在一定程度上削弱了本报告的客观性。由于我们暂时没有找到一个更加合适的替代名称,在这个报告里面还是延用原来的名称(欢迎各位读者贡献更好的参数名称)。
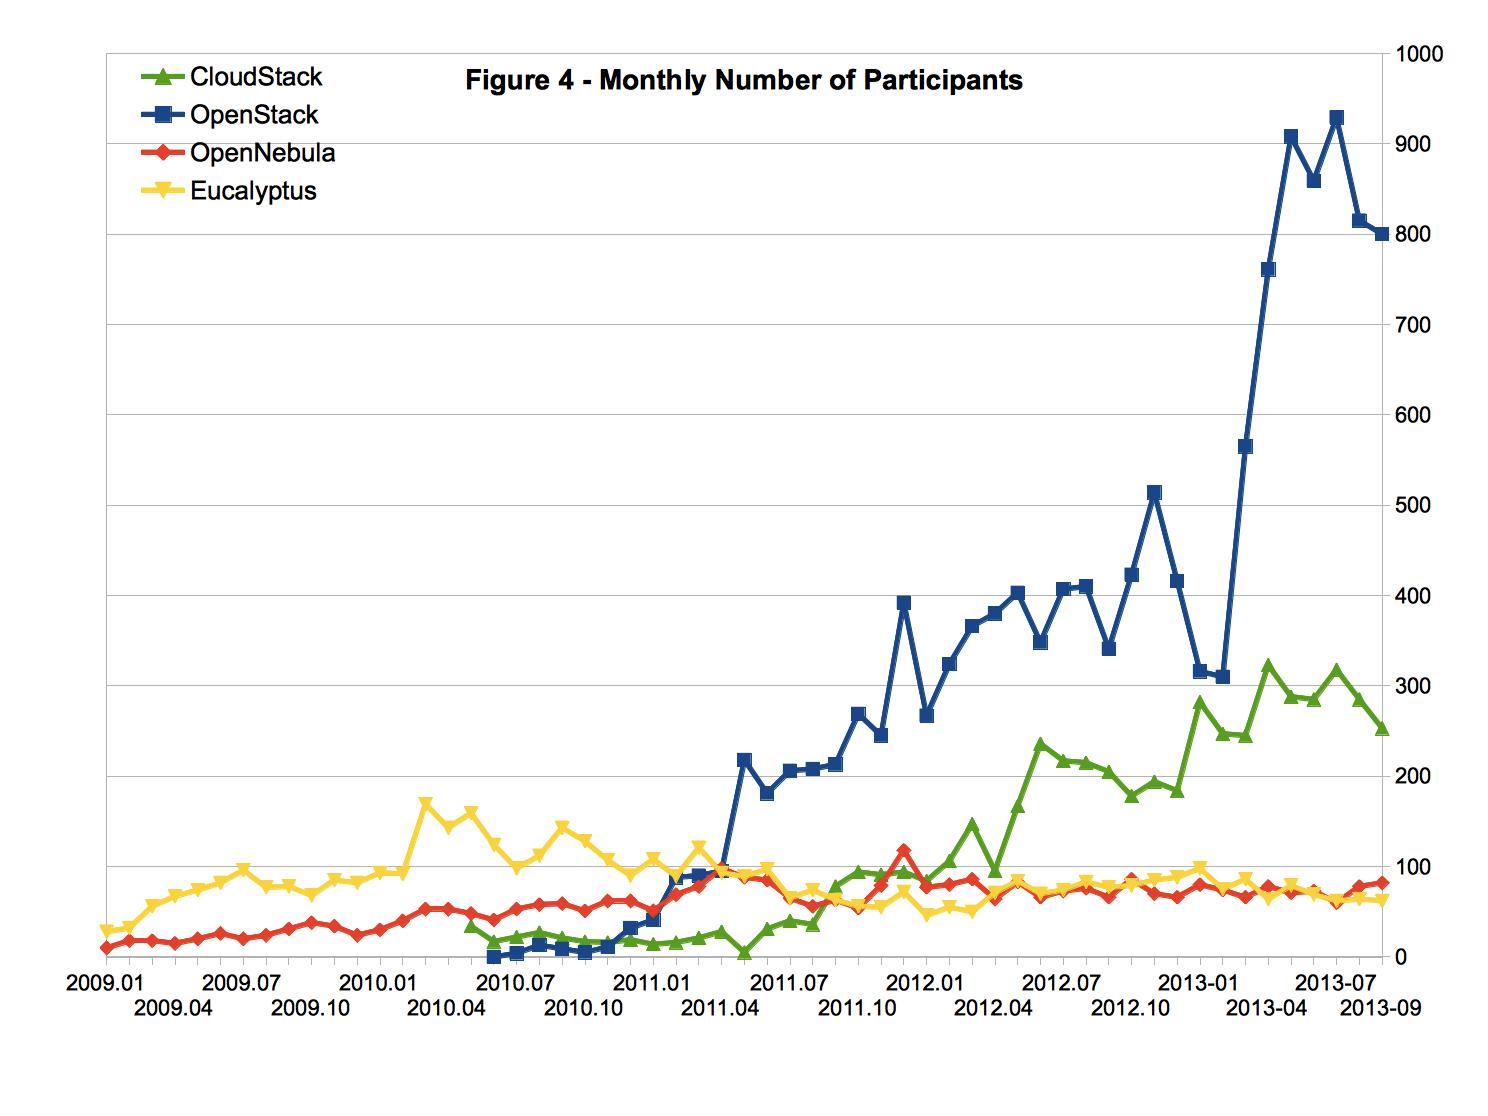
图4 所示为这四个项目每个月参与论坛或者邮件列表讨论的总人数。可以看出,OpenStack项目的活跃用户数量要远大于其他三个项目。CloudStack项目的活跃用户数量也明显大于OpenNebula和Eucalyptus。在过去12个月中,CloudStack和OpenStack项目的活跃用户数量都在稳步攀升,而Eucalyptus和OpenNebula项目的活跃用户数量基本上没有增长。
值得一提的是,虽然CloudStack的活跃用户数量稍微小于OpenStack,这两个项目的主题和帖子数量是基本相当的(参见图1和图2)。
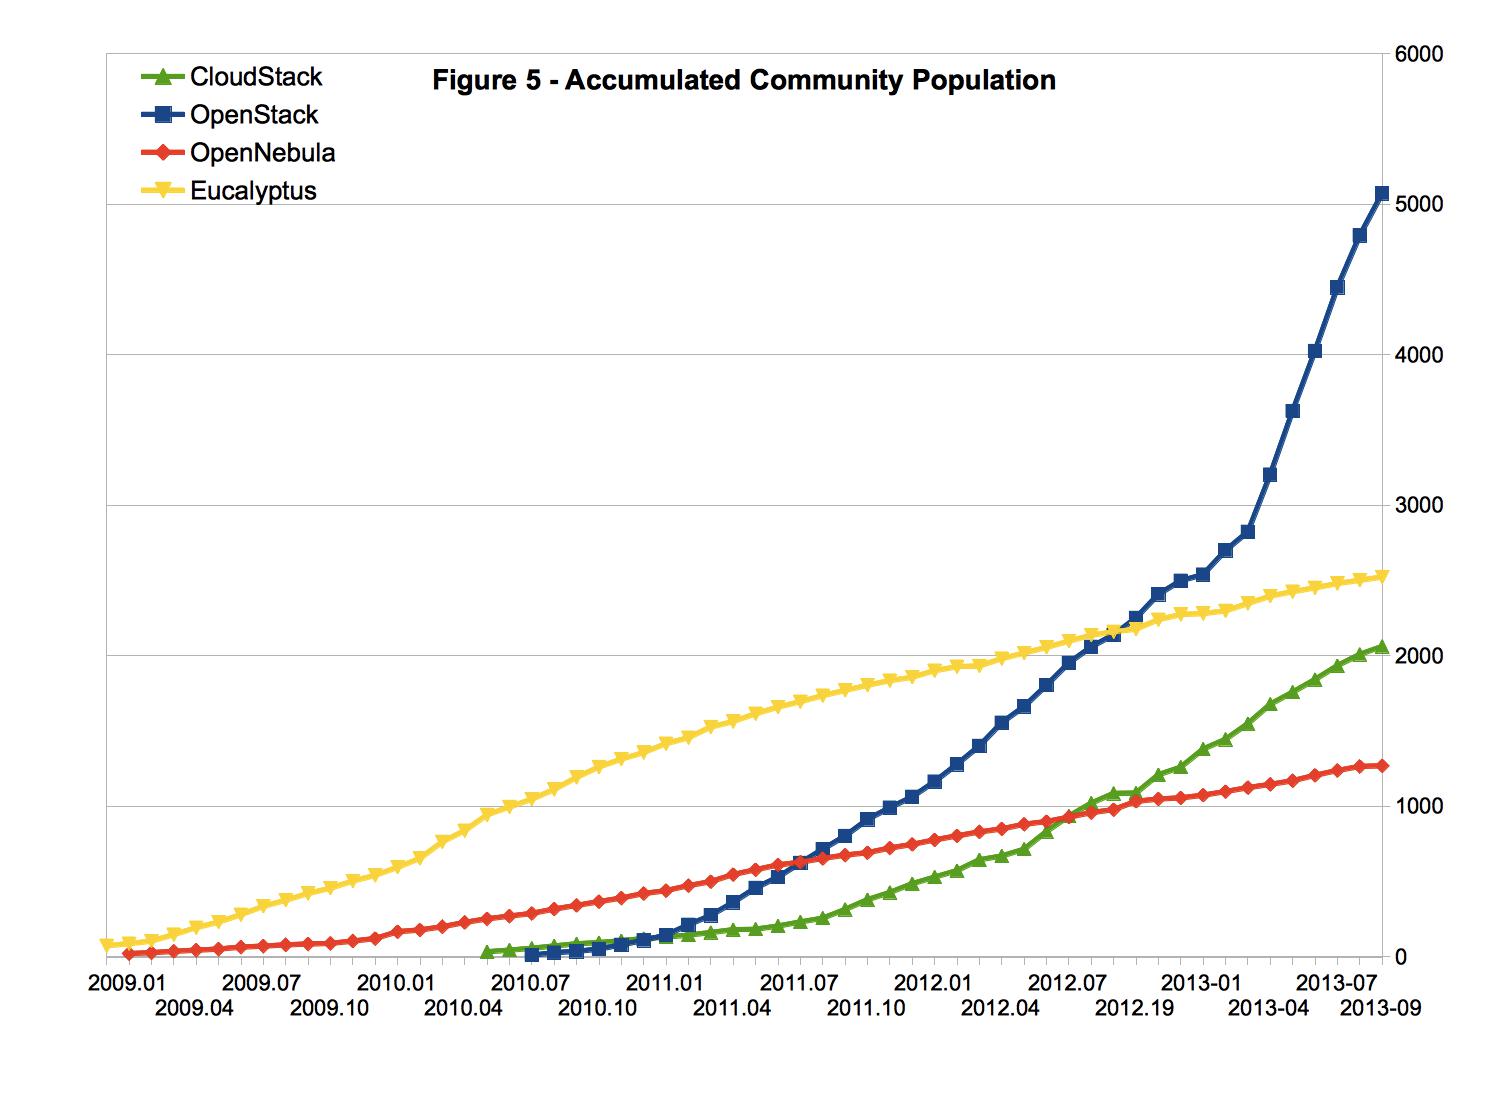
累计社区人口(简称社区人口)指的是曾经通过论坛或者邮件列表参与过讨论的用户和开发者总数。(不包括在论坛或者邮件列表中注册但是从未公开参与讨论的社 区成员。)这些人或多或少地使用过相关产品,但是并不代表他们目前还是活跃用户。图5 所示为这四个项目的社区人口增长趋势。可以看出,OpenStack与Eucalyptus项目的社区人口遥遥领先,CloudStack与OpenNebula项目的社区人口相对较低。
问题在于,开源IaaS软件经过这么多年的发展,长期累计社区人口的意义已经越来越弱。一方面,某些早期用户可能已经多次改变了阵营;另一方面,某些早期论坛和邮件列表已经结束了历史使命。从社区活跃度的角度来看,我们认为最近6 个月或者最近12个月的累计社区人口可能是有意义的,但是将累计社区人口无限制地延伸到侏罗纪时代,可能会使这个参数失去实用价值。
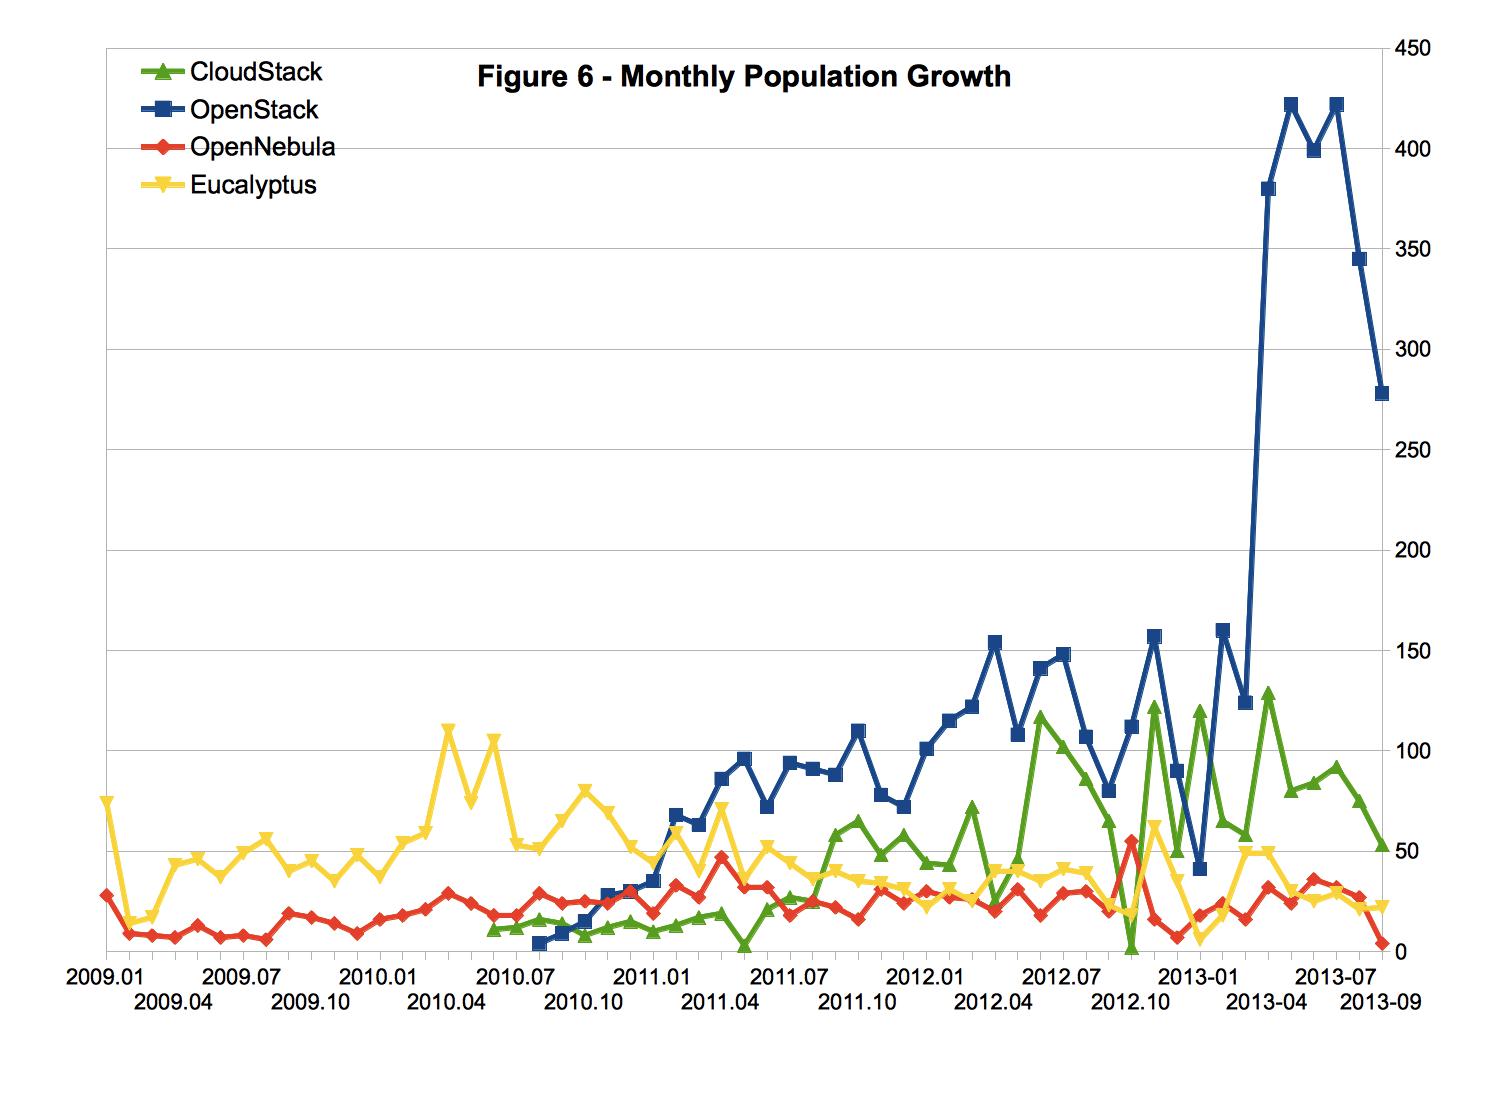
图6 所示为这四个项目每个月新增加的社区人口数量。在过去六个月中,CloudStack与OpenStack的社区人口增长速度基本相当。
与CloudStack和OpenStack向比较,Eucalyptus和OpenNebula的社区人口增长较为缓慢。
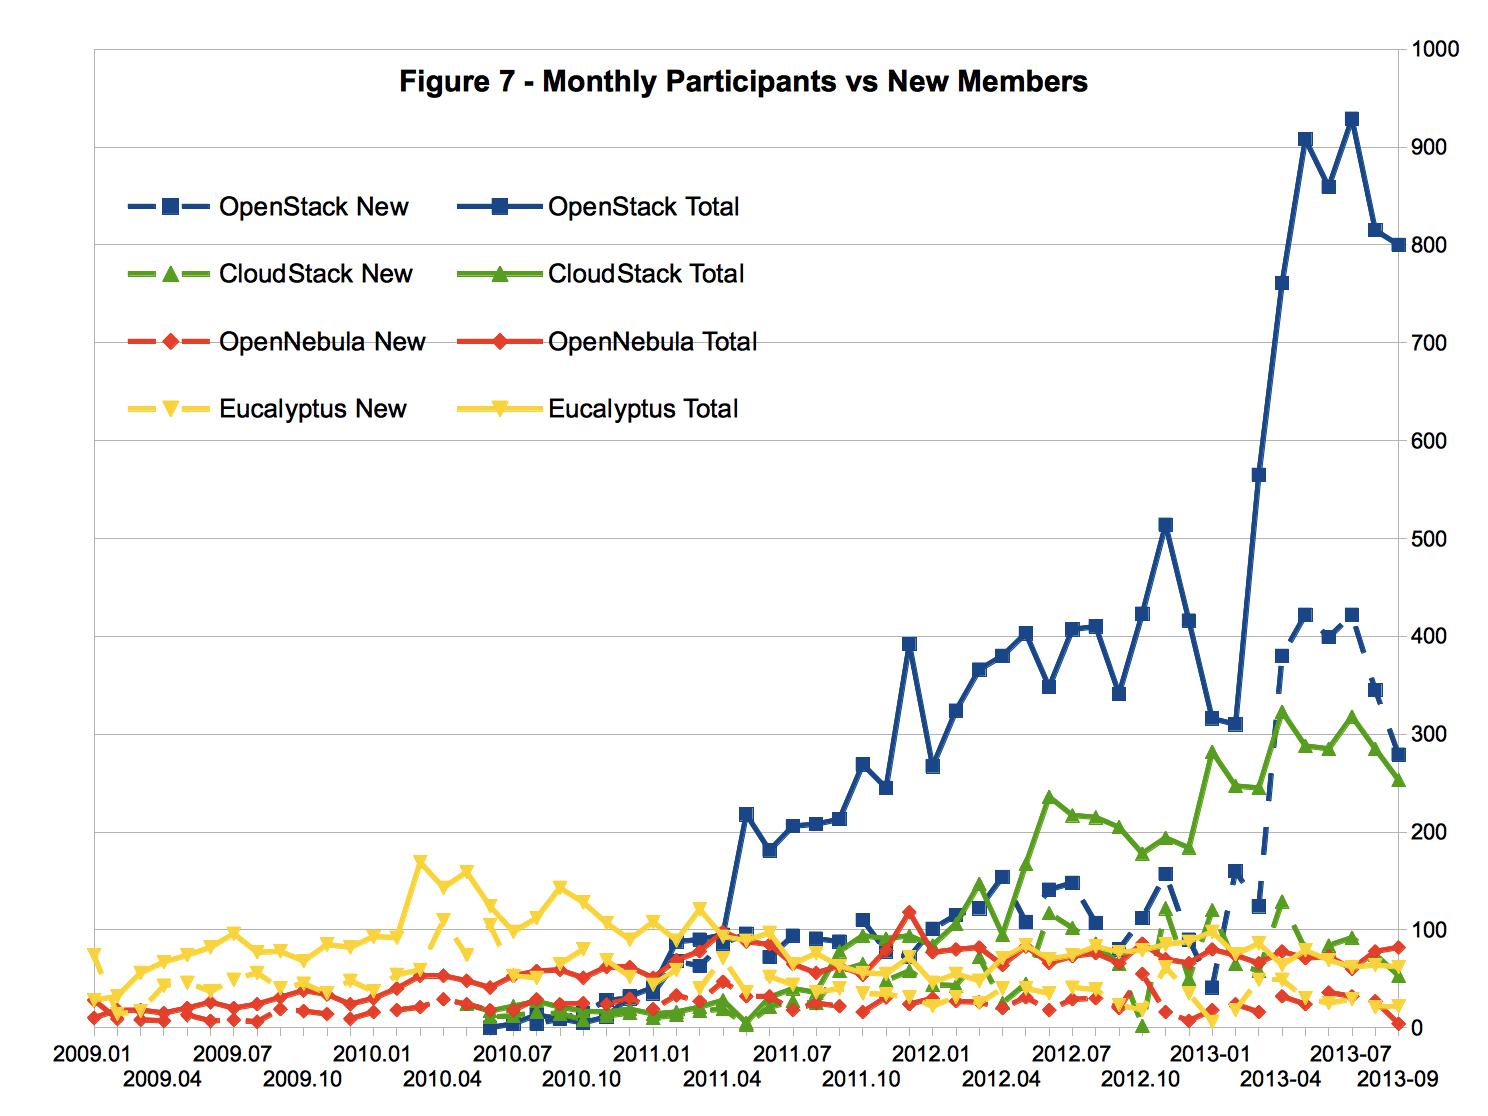
图7 是图4 与图6的重新组合。其中,实线部分表示的是每个月参与论坛或者邮件列表讨论的人数,虚线部分表示的是每个月新加入论坛或者邮件列表的人数。
在过去12个月中,OpenStack与CloudStack项目的新增人口占当月活跃用户的30%左右,OpenNebula与Eucalyptus项目大概是50%。如 果不考虑社区人口的规模的话,可以认为OpenStack与CloudStack社区的粘性大于OpenNebula与Eucalyptus社区。
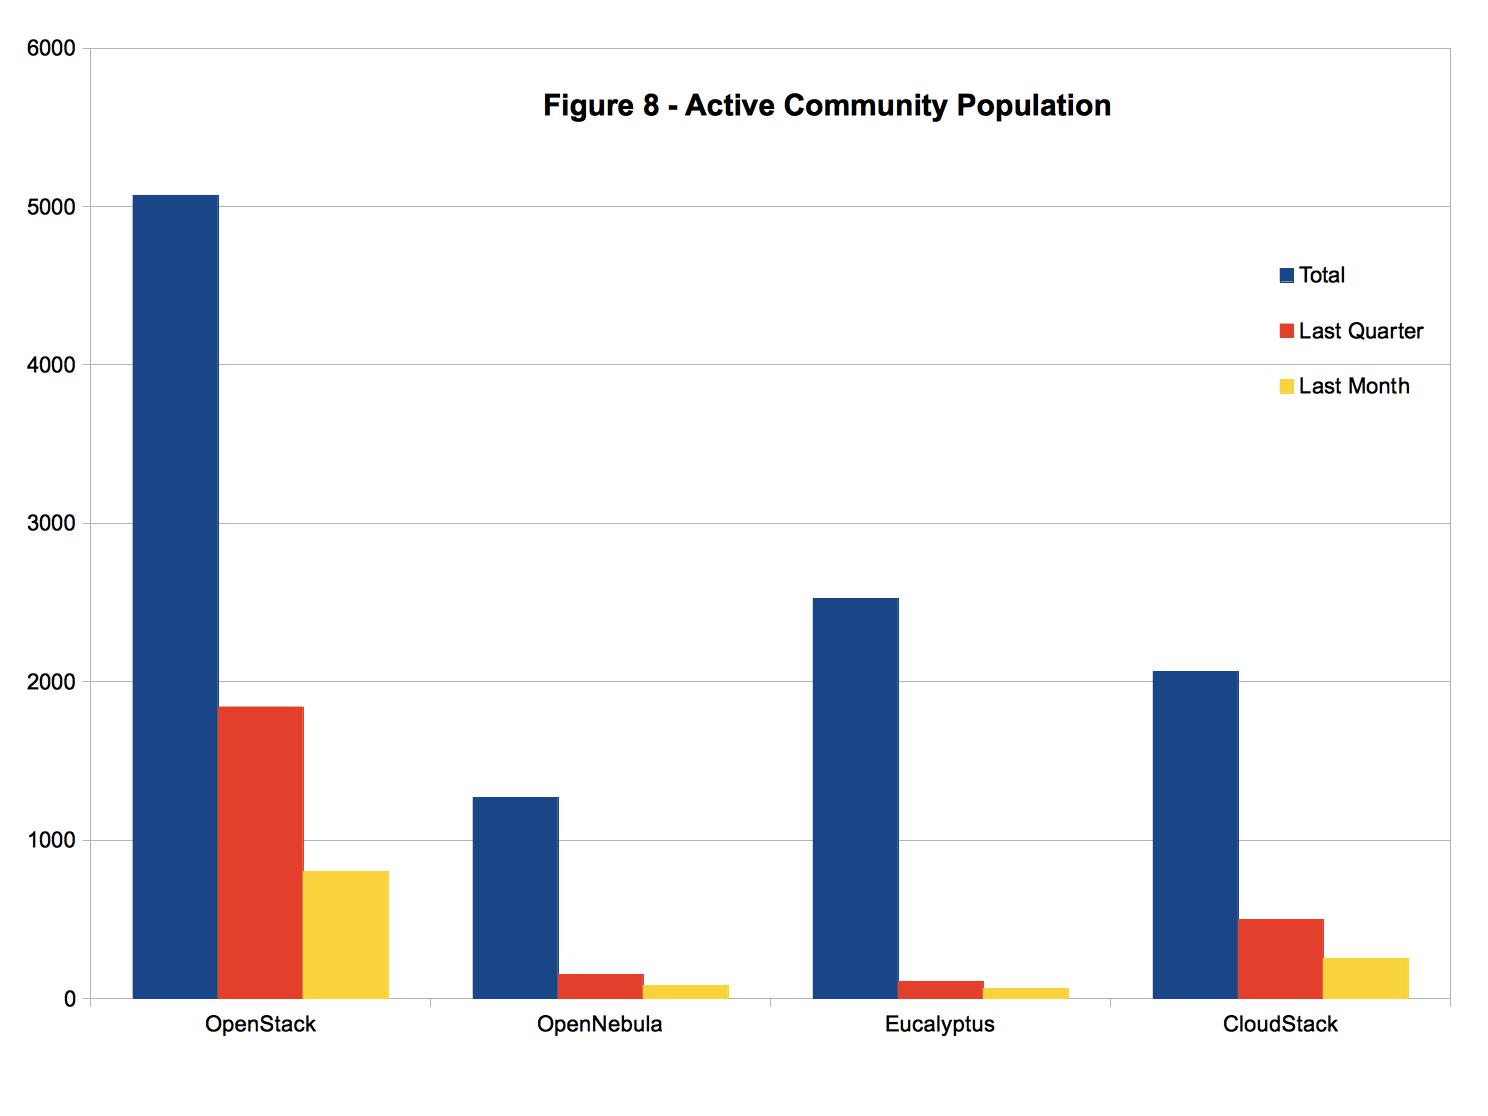
图8 所示分别是本文所述四个项目的社区人口,过去一个季度的活跃用户数量,以及过去一个月的活跃用户数量。可以看出:
(1) OpenStack的社区人口最多,然后是Eucalyptus、CloudStack、OpenNebula;
(2) 在过去一个季度中,OpenStack的活跃人口最多,然后是CloudStack、Eucalyptus、OpenNebula;
(3) 在过去一个月份中,OpenStack的活跃人口最多,然后是CloudStack、Eucalyptus、OpenNebula。
我们还计算了本季度活跃人口与累计社区人口的比值。对OpenStack项目来说,这个比值是36.3%;对于CloudStack项目来说,这个比值是24.2%;对于OpenNebula项目来说,这个比值是11.8%;对于Eucalyptus项目来说,这个比值是4.3%。很显然,相当部分的OpenStack和CloudStack社区成员选择了留下,而大部分的Eucalyptus社区成员选择了离开。这与我们在图7 中所观察到的现象(OpenStack与CloudStack社区的粘性大于OpenNebula与Eucalyptus社区)是一致的。
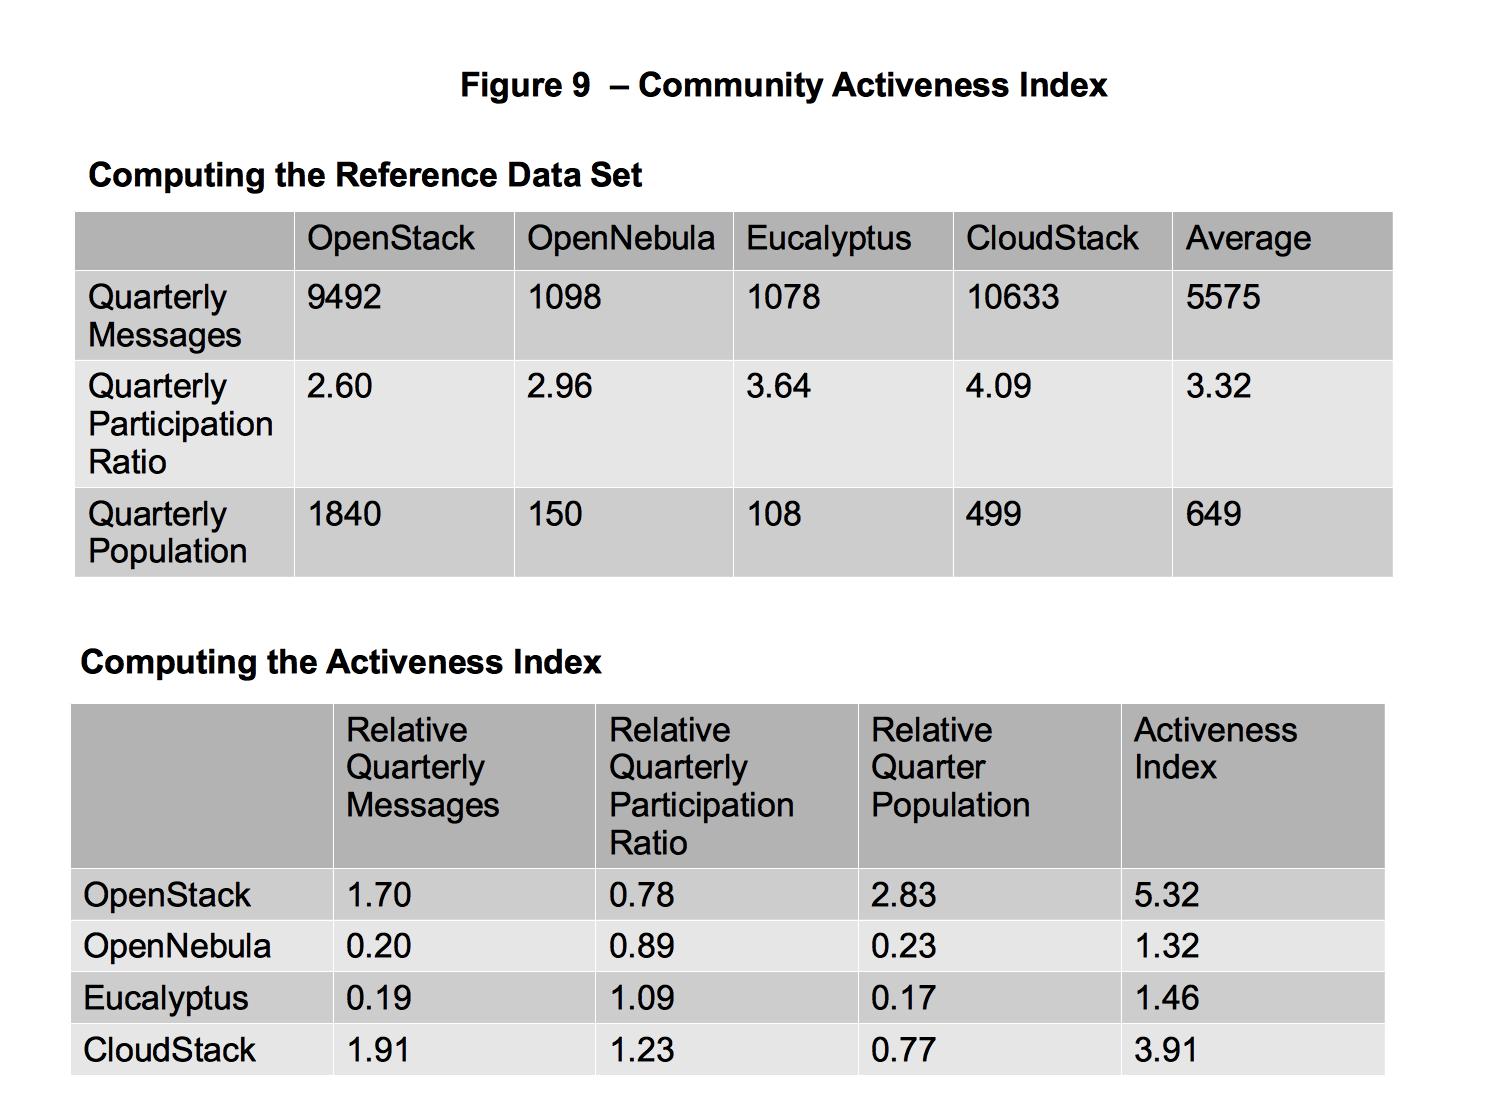
在CY12-Q3分析中,我们首次提出了“社区活跃度指数”这样一个参数。从CY13-Q3开始,这个参数修改为如下几个参数的组合:
(1) 本季度帖子总数,代表相关讨论的规模;
(2) 本季度参与度,代表每个问题获得的回帖数量;
(3) 本季度活跃用户,代表从社区获得帮助的可能性(长期)。
在这个分析中,我们选择如上各个社区的平均值作为参考数据,并将每个社区的数据与参考数据进行比较。我们将每个社区各个参数与平均值的比值之和称为“社区活跃度指数”。可以认为,社区活跃度指数最高的项目,是最活跃的项目。
从图9 中可以看出,目前OpenStack项目的“社区活跃度指数”最高(以明显的优势领先),然后是CloudStack、Eucalyptus、 OpenNebula。
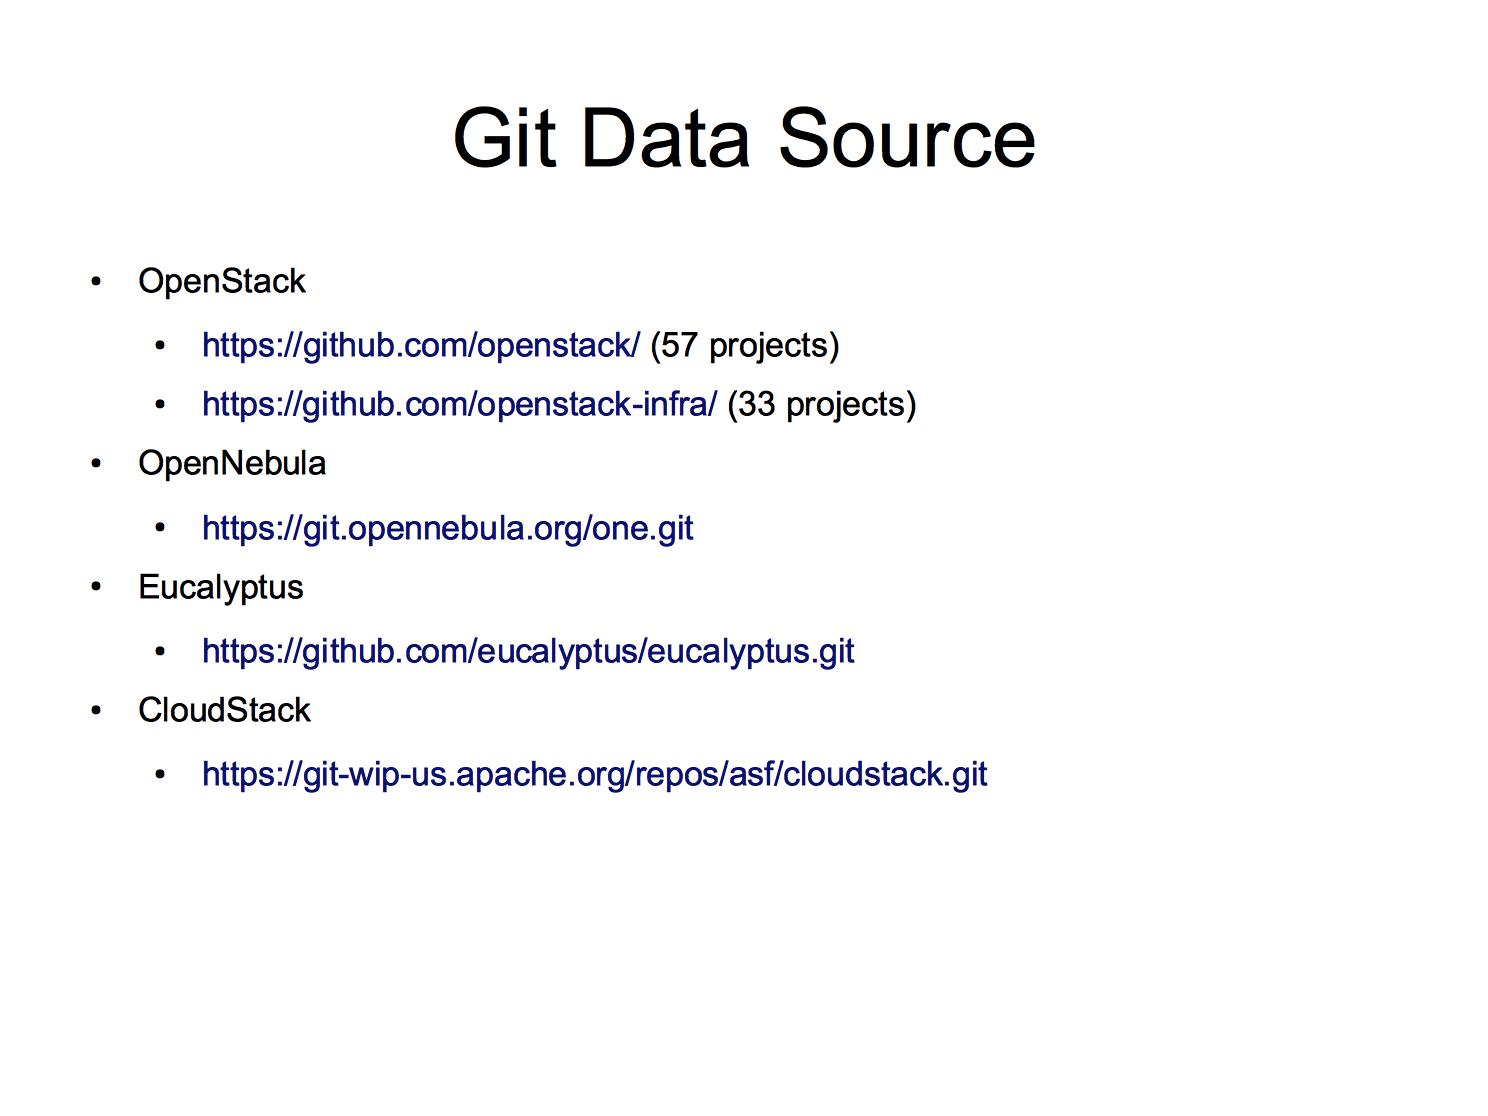
曾经有多位读者建议我们基于Git活动对各个主流的开源IaaS项目的开发情况进行分析。我们注意到CloudStack、Eucalyptus、OpenNebula以及OpenStack项目都使用git进行版本管理。因此,我们基于来自git的日志数据对这几个项目的开发情况进行了一些简单的分析。需要指出的是,对于OpenStack项目来说,其数据源包括了托管在github.com上的openstack项目(包含57个子项目)和openstack-infra项目(包含33个子项目)。
在CY13-Q1报告中,我们使用了git log这个命令获取日志数据。从CY13-Q2起,我们将使用git log –no-merges这个命令获取日志数据。

图10所示分别是本文所述四个项目每个月进行提交(commit)操作的次数。总体来看,OpenStack项目提交代码的频率远远超过其他三个项目。这是由于OpenStack项目的数据源一共包含了90个子项目。CloudStack项目提交代码的频率也明显高于Eucalyptus和OpenNebula。与OpenNebula项目相比较,Eucalyptus项目提交代码的频率也不低,但是存在较大的波动情况,具有比较明显的批量更新的特征。OpenNebula项目提交代码的频率较低,平均每个月提交代码200次左右。
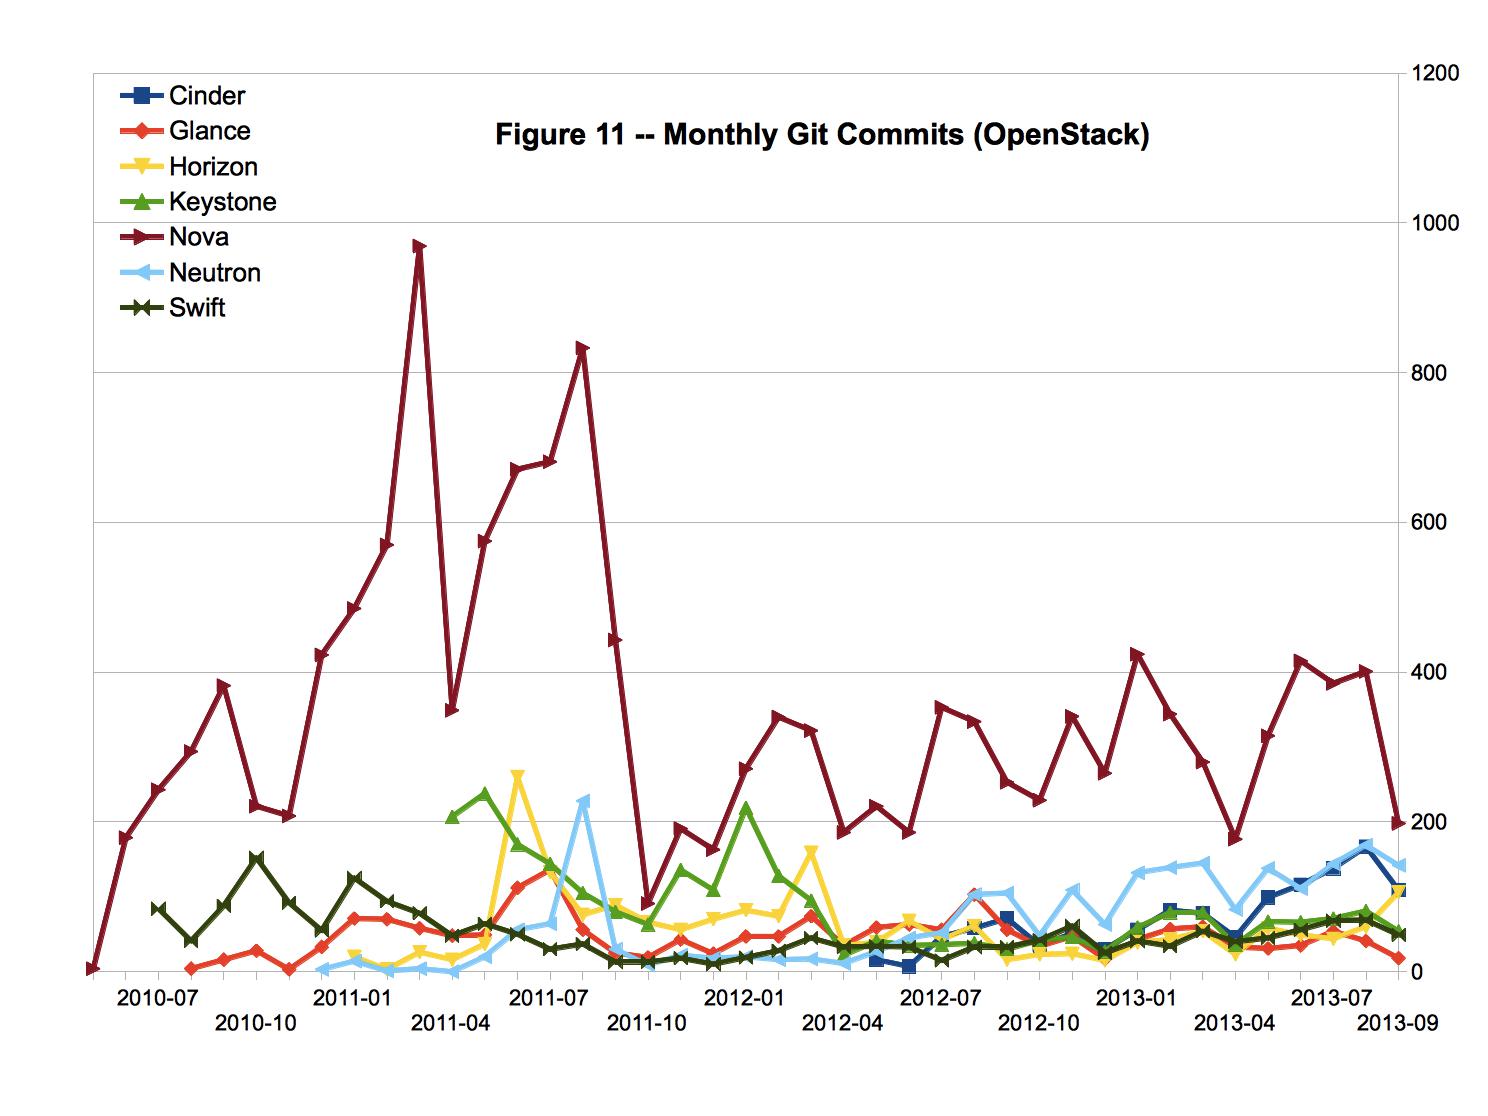
图11所示分别是OpenStack项目中各个子项目目每个月提交代码的次数。总体来看,Nova子项目提交代码的频率较高,是其他几个子项目的三倍左右。值得注意的是,尽管各个子项目提交代码的频率各不相同,但是其时程曲线基本上是一致的,波峰和波谷基本上出现在相同的时间。这个现象表明尽管OpenStack项目中各个子项目相对独立,但是具有相同或者相似的开发计划和开发进度。可以认为,OpenStack项目在子项目的管理和协调方面是做得比较好的。
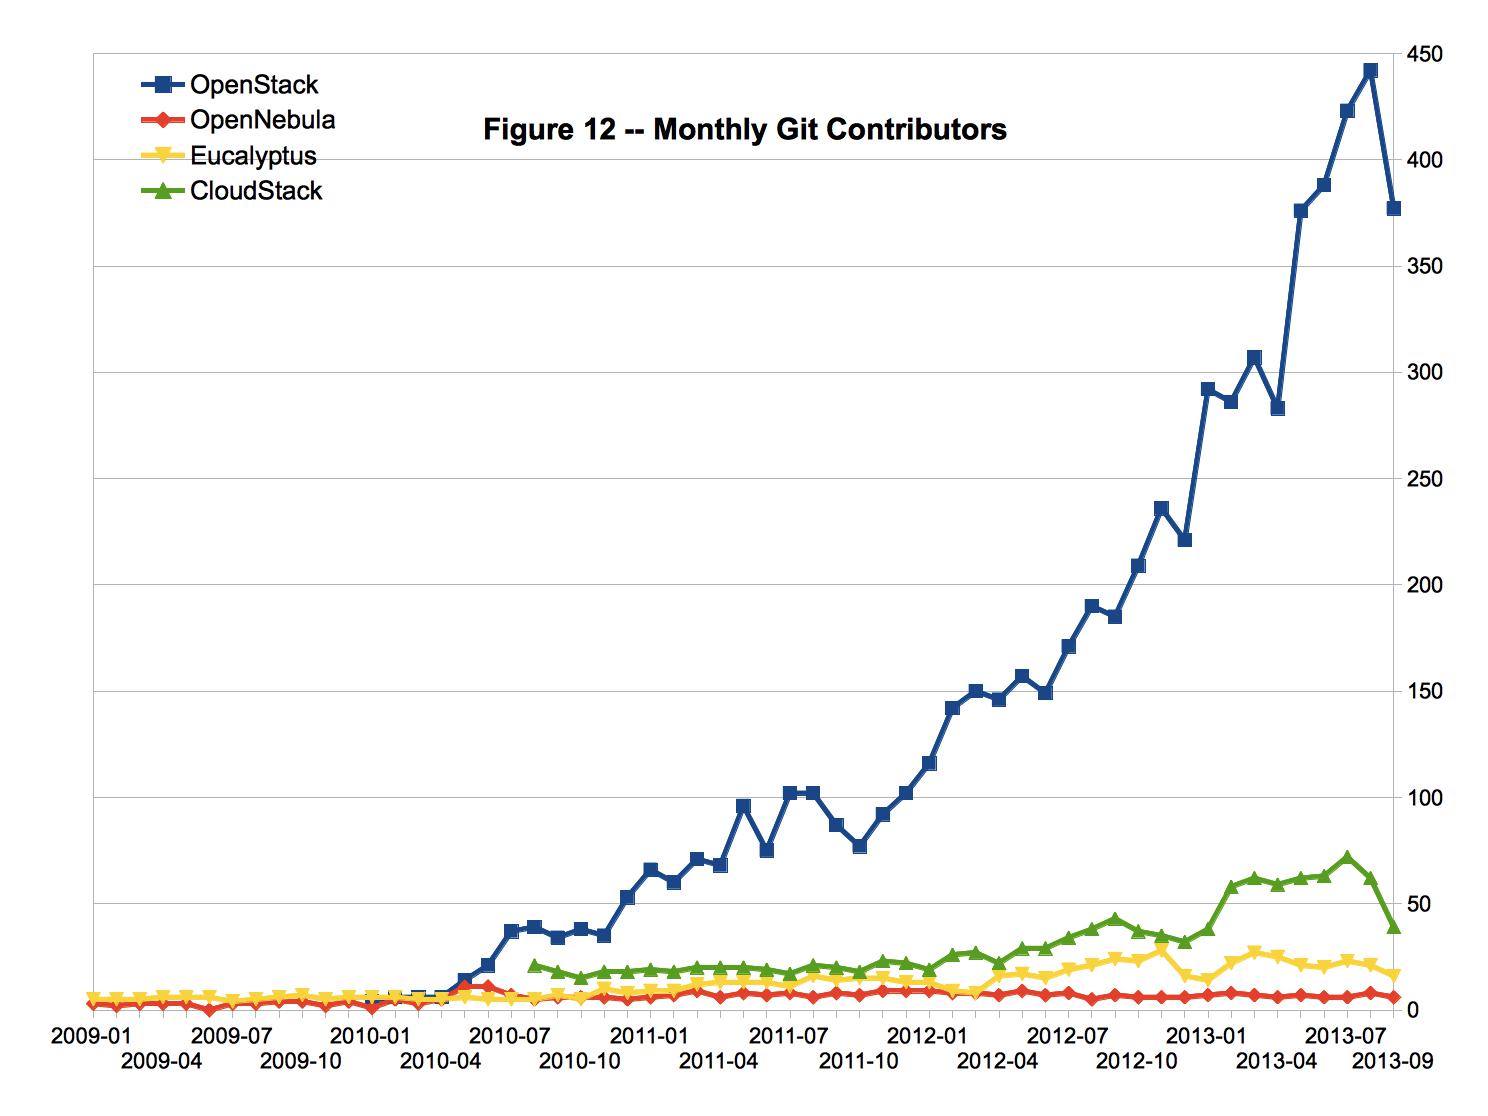
图12所示分别是本文所述四个项目每个月提交代码的人数。总体来看,OpenStack项目提交代码的人数远远超过其他三个项目,并且一直保持迅猛增长的势头。CloudStack项目提交代码的人数也有所增长,但是其增长速度较为缓慢。Eucalyptus项目和OpenNebula项目提交代码的人数相对较少,并且在过去12个月当中基本上没有增长。
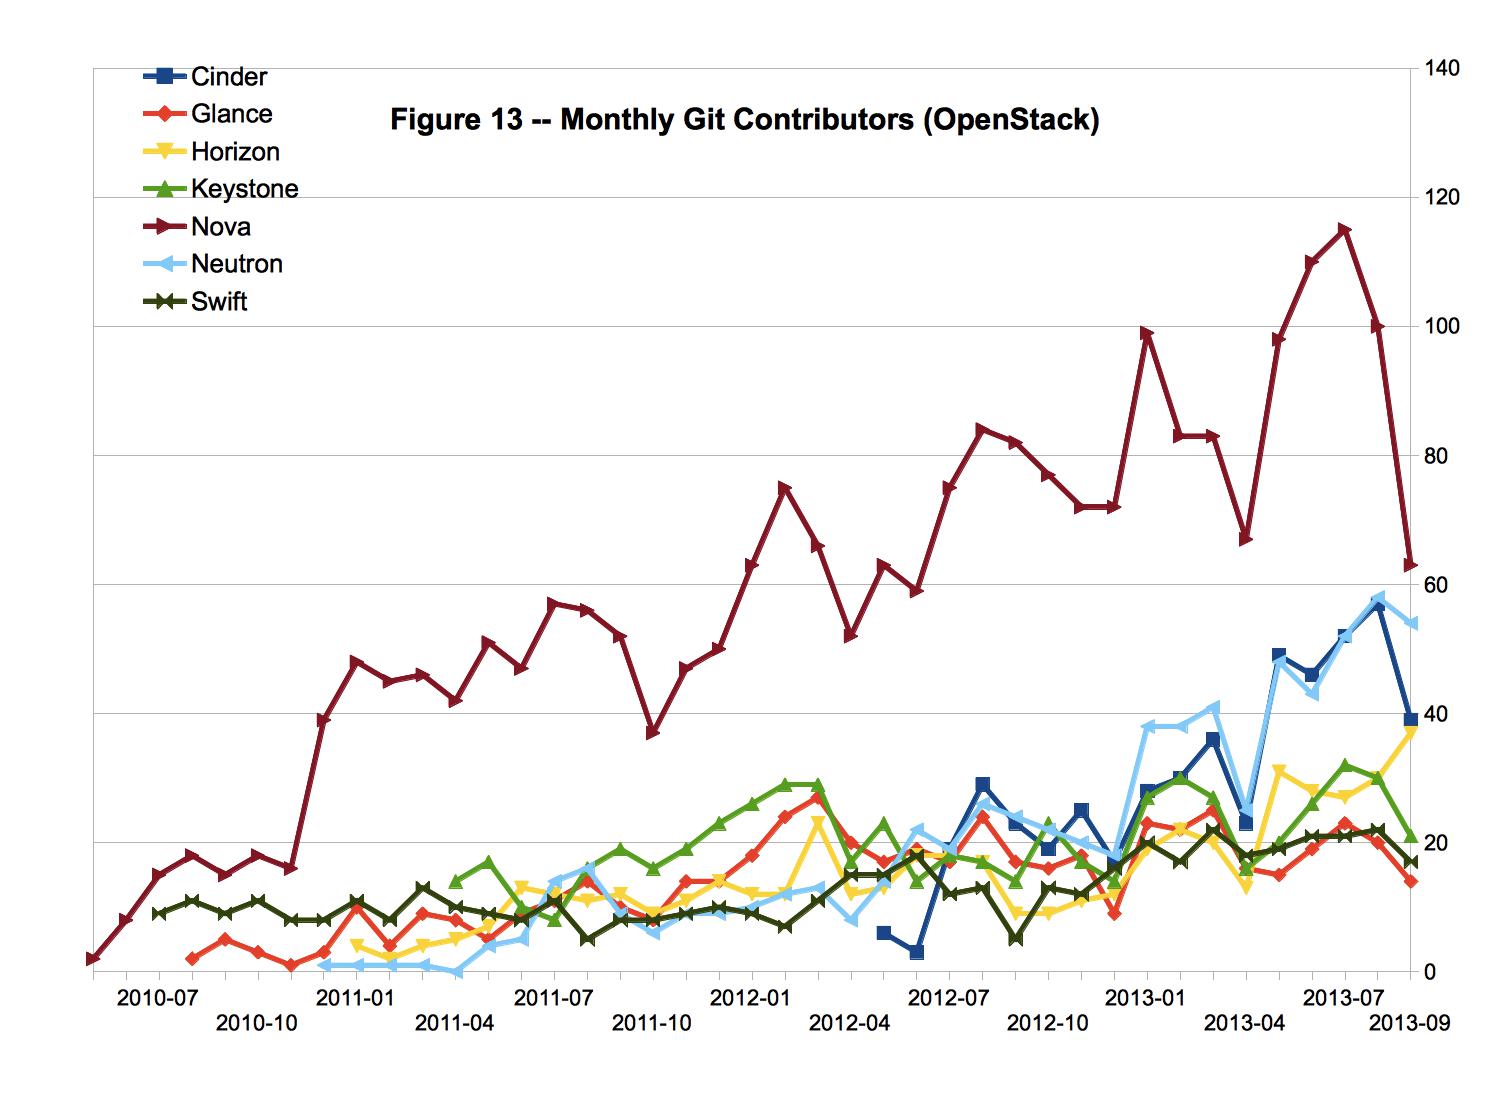
图13所示分别是OpenStack项目中各个子项目每个月提交代码的人数。总体来看,Nova子项目提交代码的人数较多,是其他几个子项目的三倍左右。
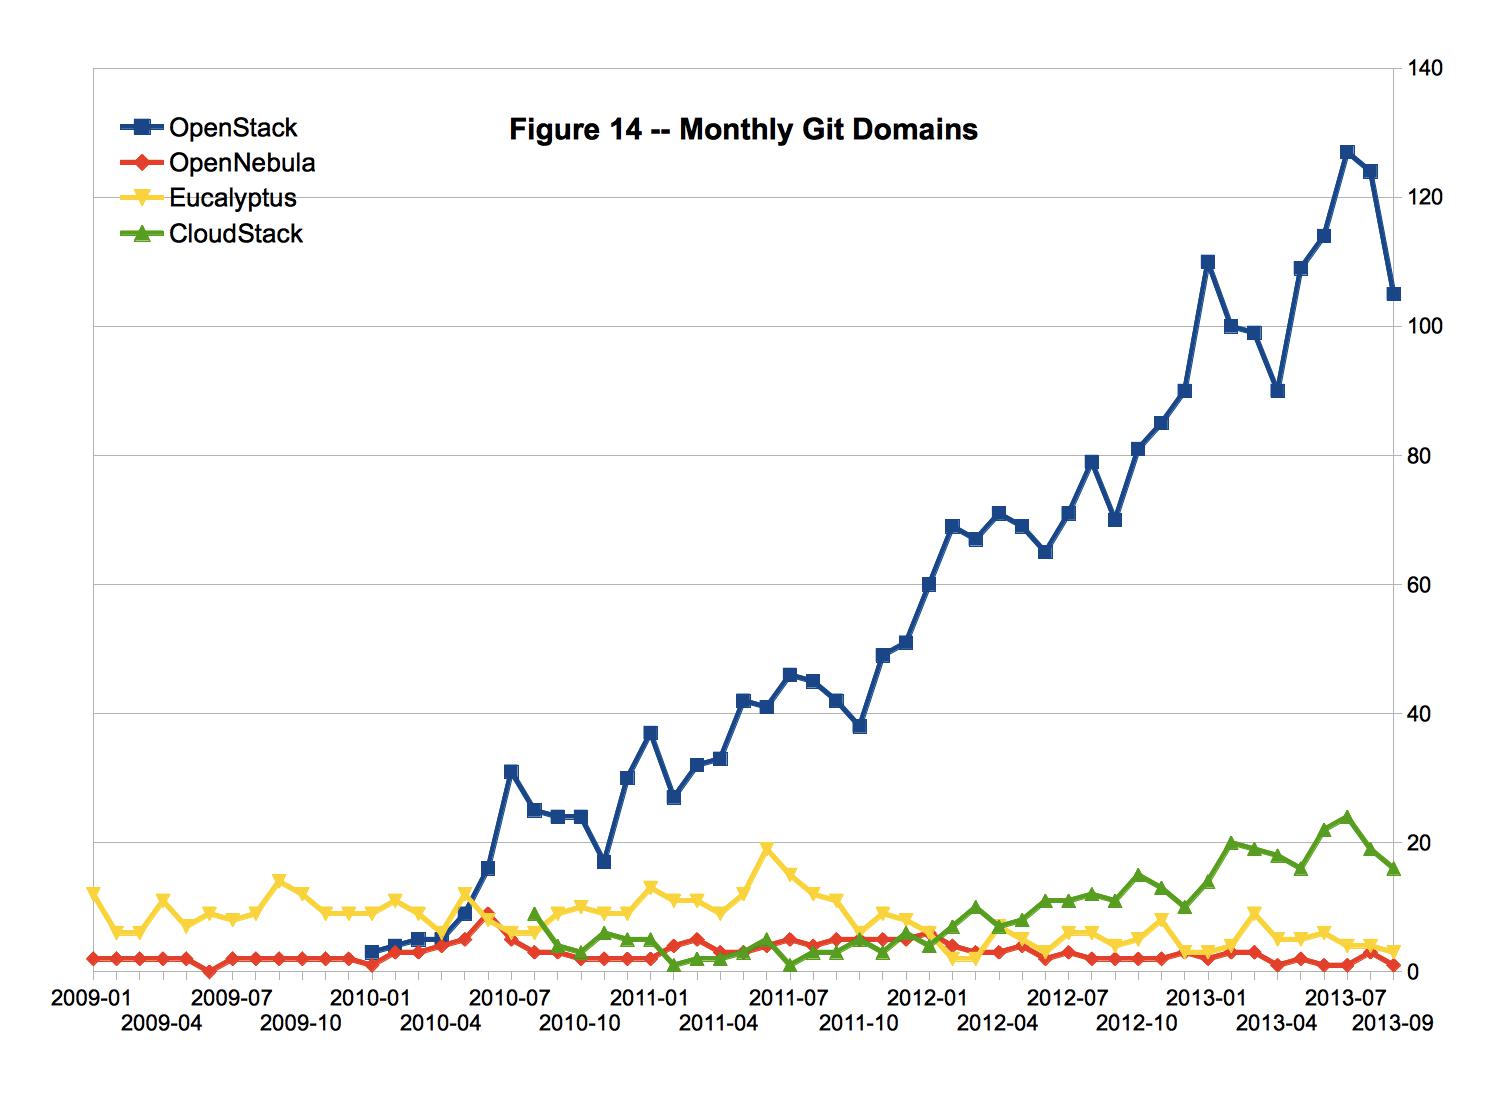
人们通常通过代码贡献者所使用的电子邮件地址来识别其所在的机构。尽管这种方式存在较大的缺陷(例如有一些机构鼓励雇员以个人的名义向开源项目贡献代码),但是还是可以从某种程度上揭示不同机构对某个开源项目的贡献力度。图14所示分别是每个月向本文所述四个项目提交代码(commit操作)的邮件地址所属域名数量。总体来看,OpenStack项目提交代码的域名数量远远超过其他三个项目,并且一直保持迅猛增长的势头。CloudStack项目提交代码的域名数量也有所增长,但是其增长速度较为缓慢。Eucalyptus项目和OpenNebula项目提交代码的域名数量相对较少,并且在过去12个月当中基本上没有增长。
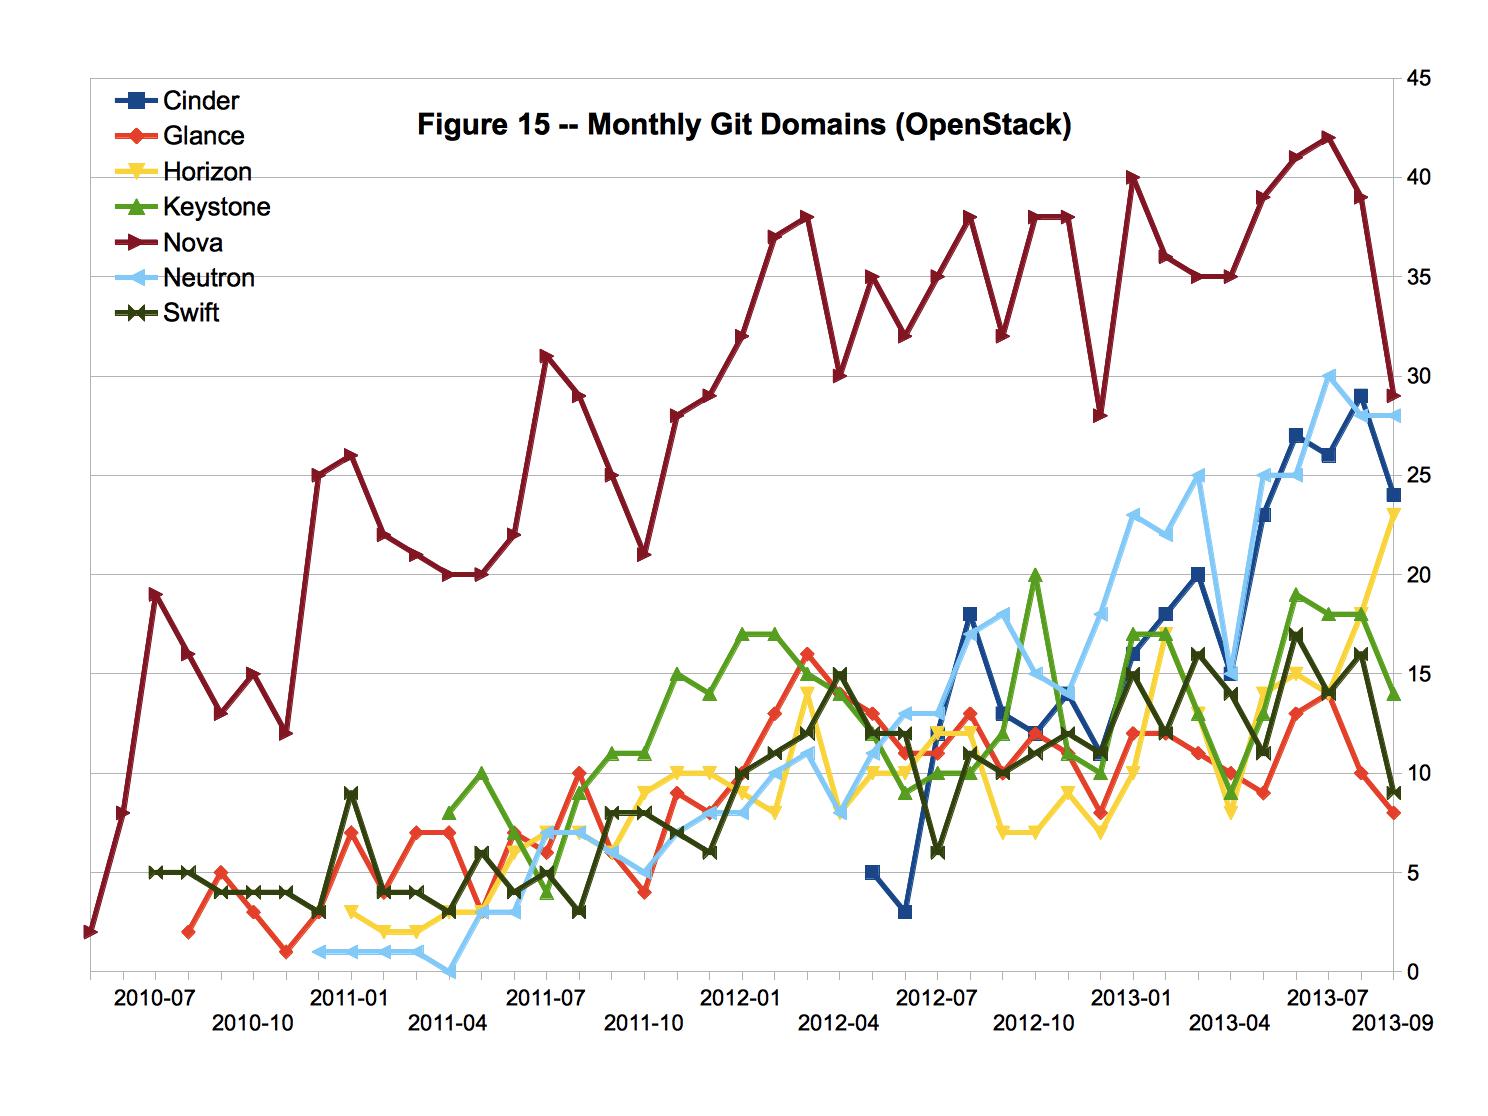
图15所示分别是OpenStack项目中各个子项目每个月提交代码(commit操作)的域名数量。总体来看,Nova子项目提交代码的域名数量较多,是其他几个子项目的三倍左右。
下面这个表格以电子邮件所属域名的形式列出了在CY13-Q3期间向CloudStack、Eucalyptus、OpenNebula和OpenStack项目贡献代码次数最多的机构(以及贡献代码次数的百分比)。可以看出,Eucalyptus和OpenNebula属于以单一机构为主导的开源项目,而CloudStack和OpenStack属于由多家机构共同合作的开源项目。对于CloudStack项目来说,来自Citrix的影响依然非常明显,直接来自citrix.com和cloud.com的邮件地址占了48%(与CY13-Q2相比较降低了3%)。对于OpenStack项目来说,来自RedHat的贡献占了15%,来自IBM的贡献占了11%,来自HP的贡献占了5%,来自Mirantis和Rackspace的贡献各占了4%。
| CloudStack | Eucalyptus | OpenNebula | OpenStack | ||||
| Domain | % | Domain | % | Domain | % | Domain | % |
| citrix.com | 46 | eucalyptus.com | 50 | opennebula.org | 99.4 | redhat.com | 15 |
| apache.org | 23 | gmail.com | 40 | gmail.com | 0.3 | gmail.com | 14 |
| gmail.com | 12 | brainfood.com | 8 | tobru.ch | 0.3 | ibm.com | 11 |
| leaseweb.com | 3 | fedoraproject.org | 1 | openstack.org | 6 | ||
| cloud.com | 2 | hp.com | 5 | ||||
| schubergphilis.com | 2 | rackspace.com | 4 | ||||
| clogeny.com | 2 | mirantis.com | 4 | ||||
| widodh.nl | 1 | inaugust.com | 2 | ||||
| betterservers.com | 0.6 | suse.de | 2 | ||||
| ianduffy.ie | 0.6 | enovance.com | 1 | ||||
下面这个表格以电子邮件所属域名的形式列出了在CY13-Q2期间向OpenStack项目各个子项目贡献代码最多的机构(以及贡献代码次数的百分比)。值得一提的是,程辉所创建的UnitedStack几乎在所有的子项目中都有突出的贡献,杜玉杰所在的九洲云对Glance项目的贡献也较为突出(九洲云在CY13-Q2中对Keystone项目有突出贡献)。此外,我们注意到Intel公司也开始向OpenStack贡献代码。我们知道Intel公司自从OpenStack项目创建之初就表示大力支持OpenStack项目。以前Intel公司内部试图在OpenStack的一个早期版本的基础上打造一个Intel自己的OpenStack发行版,并导致了Intel自己的OpenStack版本与OpenStack主干不相兼容的情况。显然,Intel公司已经意识到更好的选择是直接加入OpenStack主干的开发,而不是关起门来在家里自己搞一个发行版。
| Cinder | Glance | Horizon | Keystone | ||||
| Domain | % | Domain | % | Domain | % | Domain | % |
| ibm.com | 14 | rackspace.com | 22 | da.jp.nec.com | 17 | ibm.com | 33 |
| hp.com | 14 | gmail.com | 21 | redhat.com | 15 | gmail.com | 12 |
| gmail.com | 9 | ibm.com | 18 | gmail.com | 13 | redhat.com | 11 |
| solidfire.com | 8 | hp.com | 9 | hp.com | 11 | metacloud.com | 7 |
| mirantis.com | 7 | redhat.com | 7 | mirantis.com | 7 | 99cloud.net | 5 |
| intel.com | 7 | intel.com | 3 | metacloud.com | 4 | hp.com | 4 |
| openstack.org | 6 | dmllr.de | 2 | strikeawe.com | 3 | marantis.com | 3 |
| redhat.com | 4 | 99cloud.net | 2 | gmx.de | 2 | inaugust.com | 3 |
| unitedstack.com | 3 | outlook.com | 2 | b1-systems.de | 2 | openstack.org | 3 |
| canonical.com | 3 | canonical.com | 1 | unitedstack.com | 1 | unitedstack.com | 2 |
| Nova | Neutron | Swift | |||||
| Domain | % | Domain | % | Domain | % | ||
| ibm.com | 26 | gmail.com | 19 | gmail.com | 36 | ||
| redhat.com | 14 | openstack.org | 16 | redhat.com | 20 | ||
| gmail.com | 11 | nicira.com | 11 | swiftstack.com | 8 | ||
| mirantis.com | 6 | mirantis.com | 8 | enovance.com | 7 | ||
| rackspace.com | 5 | cisco.com | 7 | kotori.zaitcev.us | 5 | ||
| codestud.com | 4 | ibm.com | 4 | unitedstack.com | 2 | ||
| intel.com | 4 | unitedstack.com | 3 | not.mn | 2 | ||
| vmware.com | 3 | redhat.com | 3 | dmllr.de | 2 | ||
| citrix.com | 1 | da.jp.nec.com | 2 | brim.net | 2 | ||
| canonical.com | 1 | dreamhost.com | 2 | hp.com | 1 | ————————- | — |
与本文相关的PDF版本幻灯片可以从这里下载。如果您需要重新分发本文内容,敬请您保留相关作者信息。
| 更晚内容 | 更早内容 |
云与清风常拥有,
冰雪知音世难求。
击节纵歌相对笑,
案上诗书杯中酒。
2020年12月31日
洛杉矶
最新评论
2026-07-23 11:37:04
qyjohn 评论了 《几句翻译》
2026-07-21 20:11:28
wells 评论了 《几句翻译》
2025-11-15 06:29:51
qyjohn 评论了 《青桔》
2025-11-14 01:55:04
wells 评论了 《青桔》
2025-10-24 18:04:06
Ted Wang 评论了 《关于作者(About Me)》
2025-03-27 08:28:09
Max 评论了 《父亲走了》
2025-03-08 04:13:52
W 评论了 《我不想颂扬普京大帝》
2024-07-22 16:02:03
云思 评论了 《无题》
2024-06-27 10:01:54
yiming 评论了 《致访客(Welcome)》
2024-05-06 08:50:06
qyjohn 评论了 《致访客(Welcome)》
2024-05-03 19:49:00
jimmie 评论了 《致访客(Welcome)》
2024-02-19 03:32:57
林小静 评论了 《埋剑渡》
2024-01-05 03:54:28
路过者 评论了 《2023年度盘点》
2024-01-04 10:22:05
qyjohn 评论了 《致访客(Welcome)》
2024-01-04 08:05:13
qyjohn 评论了 《2023年度盘点》